
Residents
36.838
Last year: 2026
6373AJ Landgraaf • Limburg
€ 1.190.000 k.k.
Cost of copper (estimated): € 25.650
2% transfer tax (€ 23.800) + notary (€ 1.150) + valuation (€ 700)
Total incl. VAT: € 1.215.650
Purchase price /m²: € 3.838
Gelegen aan Exdel 38 te Landgraaf, is deze vrijstaande villa geïnspireerd door tijdloze architectuur. De woning omvat een souterrain met een provisiekelder en hobbyruimte, en biedt op de parterre een royale living van 88 m², een open keuken, vier slaapkamers (waarvan één master bedroom met luxe badkamer) en twee aparte badkammen. Het huis is omringd door een parkachtige tuin van 3.020 m² met diverse terrassen, een dubbele garage en de mogelijkheid tot eventueel extra bouwplaatsen. Bovenstaand wooncomplex is voorzien van hardhouten kozijnen, grotendeels dubbel glas en is gebouwd met leistenen dakpannen. Het verblijf biedt uitstekend uitzicht op de Brunssummerheide en profiteert van een rustige omgeving nabij fiets- en wandelroutes.
€ 1.190.000
Cost of copper (estimated): € 25.650
2% transfer tax (€ 23.800) + notary (€ 1.150) + valuation (€ 700)
Total purchase (incl. p.p.): € 1.215.650
3,04%
Yearly
€ 59.500
Direct available
Estimated mortgage
Indicative gross monthly cost
Based on annuity and 30 year term
Indicative net monthly cost
iDisclaimer: this mortgage calculation is a simplified indication based on general assumptions. No rights can be derived from the results shown. Calculated with 10-annual interest (zonder NHG), automatically determined based on the price limit € 470.000. Source: 10-jaars rente uit mortgage_rates (24-04-2026 03:00). For non-NHG, an 80% mortgage of the market value has been used in this indication.
Ligbad, douche en toilet
Elektra en verwarming
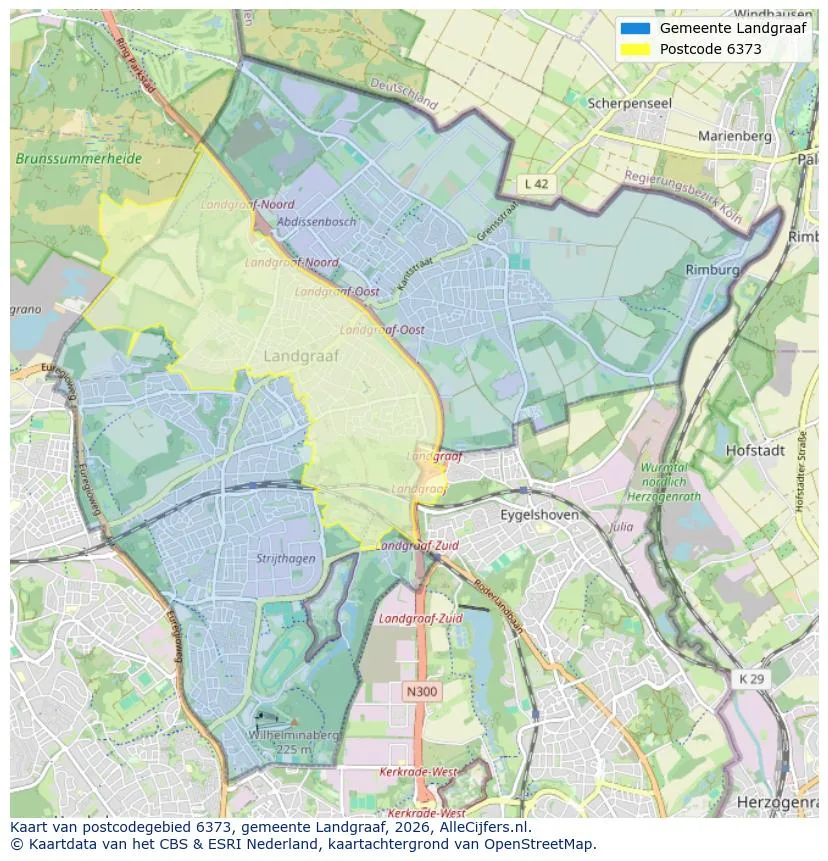
View the location and discover the brokers in this region
View current location data on residents, WOZ development, housing stock, energy consumption, business activity and safety in Landgraaf. In 2026 were there 36.838 residents. The average WOZ value in 2025 is EUR 265.000.
Residents
36.838
Last year: 2026
Average WOZ
EUR 265.000
Last year: 2025
Average income per person.
EUR 31.800
Source: AllNumbers
Crimes (current year)
1.375
Total registered
| Year | Residents |
|---|---|
| 2022 | 37.023 |
| 2023 | 37.175 |
| 2024 | 37.112 |
| 2025 | 36.839 |
| 2026 | 36.838 |
| Year | Average WOZ |
|---|---|
| 2021 | EUR 197.000 |
| 2022 | EUR 212.000 |
| 2023 | EUR 248.000 |
| 2024 | EUR 247.000 |
| 2025 | EUR 265.000 |
Hoger
23
Praktisch
34
Middelbaar
43
Europa
5.824
Nederland
27.859
Buiten Europa
3.156
Label C
4.932
Label A
3.139
Label B
2.575
Label D
2.345
Label F
2.076
Label G
1.573
Label E
1.278
Label A+
371
Label A+++
140
Label A++
120
Label A++++
22
Label A+++++
3
| Year | Gas (m3) | Electricity (kWh) |
|---|---|---|
| 2020 | 1.250 | 2.830 |
| 2021 | 1.430 | 2.870 |
| 2022 | 1.100 | 2.740 |
| 2023 | 910 | 2.660 |
| 2024 | 890 | 2.710 |
Hoekwoning
Gas: 950 • Electricity: 2.710
Huurwoning
Gas: 760 • Electricity: 2.080
Koopwoning
Gas: 1.000 • Electricity: 3.000
Appartement
Gas: 670 • Electricity: 1.900
Tussenwoning
Gas: 860 • Electricity: 2.630
Vrijstaande woning
Gas: 1.340 • Electricity: 3.890
Twee-onder-één-kap woning
Gas: 1.040 • Electricity: 2.920
Total number of company establishments: 3.090
| Period | Crimes |
|---|---|
| jan 2025 | 103 |
| jan 2026 | 120 |
| jul 2025 | 128 |
| jun 2025 | 150 |
| mei 2025 | 124 |
| mrt 2025 | 114 |
| nov 2024 | 115 |
| nov 2025 | 103 |
| okt 2024 | 107 |
| okt 2025 | 108 |
| sep 2024 | 117 |
| sep 2025 | 104 |
These figures give an indicative picture of safety trends in the living environment of Landgraaf.
Short answers based on current local statistics, handy for a quick comparison of the living environment.
Landgraaf telt in 2026 ongeveer 36.838 inwoners.
De gemiddelde WOZ-waarde in Landgraaf is in 2025 circa € 265.000.
Het gemiddelde inkomen per inwoner in Landgraaf ligt rond € 31.800 per jaar.
Voor het huidige jaar gaat het om ongeveer 1.375 geregistreerde misdrijven. Gebruik deze cijfers als indicatie en vergelijk trends per periode.
In Landgraaf komt vooral "Tussenwoningen" veel voor, met ongeveer 5.704 woningen.
View more homes in this location.
6374PG Landgraaf
€ 679.000 k.k.

6374AS Landgraaf
€ 295.000 k.k.
6372KH Landgraaf
€ 419.000 k.k.

6372ET Landgraaf
€ 525.000 k.k.

6372EL Landgraaf
€ 930 p/m
€ 16/m²

6374CZ Landgraaf
€ 398.000 k.k.
€ 2.948/m²
6374JA Landgraaf
€ 269.000 k.k.
€ 2.989/m²

6372EM Landgraaf
€ 170.000 k.k.
€ 2.615/m²
