
Residents
20.230
Last year: 2025
4143AS Leerdam • Utrecht
€ 380.000 k.k.
Cost of copper (estimated): € 9.450
2% transfer tax (€ 7.600) + notary (€ 1.150) + valuation (€ 700)
Total incl. VAT: € 389.450
Purchase price /m²: € 3.304
U HEEFT EEN OBJECTCODE NODIG ALS U ONS BELT. DE CODE IS: 8 3 1 1 5 Kijk op de pagina 'koop' van de website stavastplus.nl voor de toewijzingsprocedure en verkoopregels. Als u reageert, vergeet dan niet het aanmeldformulier te downloaden en samen met de meest recente 'verklaring geregistreerd inkomen' te mailen. Als u op dit moment in een zelfstandige woning van een andere woningcorporatie dan KleurrijkWonen woont, stuur dan ook een kopie van het getekende huurcontract mee. Alleen dan kunnen wij uw aanmelding in behandeling nemen. De sluitingsdatum is dinsdag 3 juni om 12.00 uur. Omschrijving woning Energiezuinige (label B) tussenwoning met stenen berging en onderhoudsvriendelijke achtertuin met achterom. Deze ruime woning is o.a. voorzien van dubbele beglazing, gevelisolatie en dakisolatie. Verwarming geschiedt via een Nefit HR combiketel, ook is er een zonneboiler geplaatst. Indeling Entree; royale hal met toilet en meterkast en trapopgang; woonkamer met schouw; keuken met deur naar de tuin. 1e verdieping: 3 slaapkamers; badkamer met douche en wastafel; vaste trap naar .... 2e verdieping: voorzolder met cv-opstelling en zonneboiler; extra zolderkamer. Op al onze woningen zijn de wettelijke voorwaarden van toepassing. Hierin is onder andere opgenomen dat wij alleen mogen verkopen aan natuurlijke personen voor zelfbewoning.
€ 380.000
Cost of copper (estimated): € 9.450
2% transfer tax (€ 7.600) + notary (€ 1.150) + valuation (€ 700)
Total purchase (incl. p.p.): € 389.450
2,78%
Yearly
€ 19.000
Direct available
Estimated mortgage
Indicative gross monthly cost
Based on annuity and 30 year term
Indicative net monthly cost
iDisclaimer: this mortgage calculation is a simplified indication based on general assumptions. No rights can be derived from the results shown. Calculated with 10-annual interest (met NHG), automatically determined based on the price limit € 470.000. Source: 10-jaars rente uit mortgage_rates (25-04-2026 04:00).
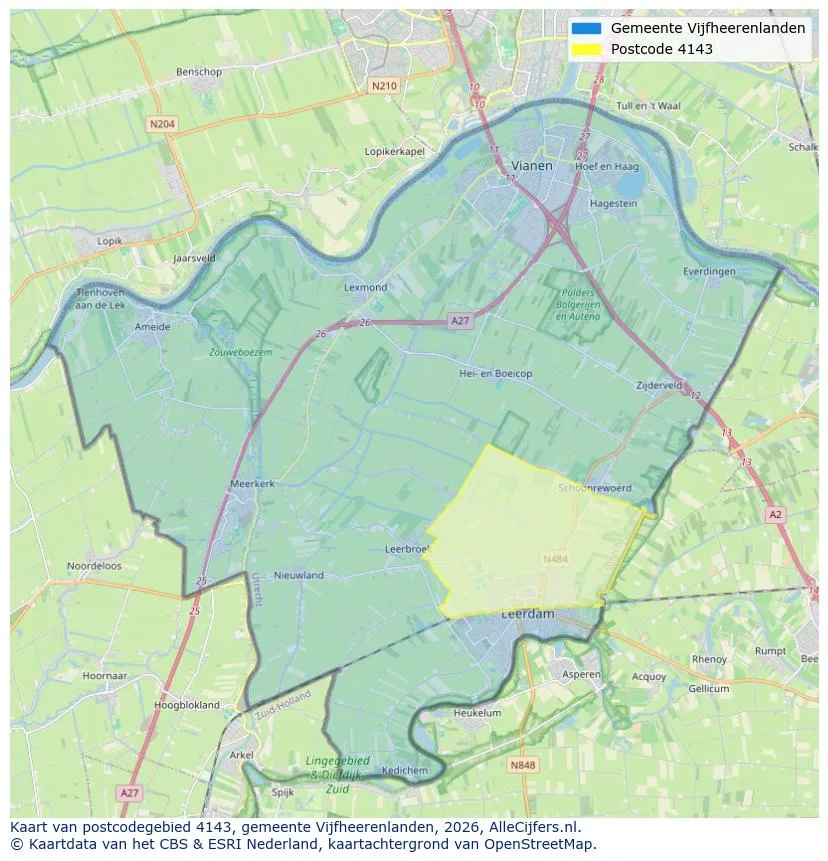
Spatial overview of the work area in Leerdam
View current location data on residents, WOZ development, housing stock, energy consumption, business activity and safety in Leerdam. In 2025 were there 20.230 residents. The average WOZ value in 2025 is EUR 349.940.
Residents
20.230
Last year: 2025
Average WOZ
EUR 349.940
Last year: 2025
Average income per person.
EUR 26.431
Source: AllNumbers
Crimes (current year)
584
Total registered
| Year | Residents |
|---|---|
| 2021 | 18.930 |
| 2022 | 19.260 |
| 2023 | 19.615 |
| 2024 | 20.095 |
| 2025 | 20.230 |
| Year | Average WOZ |
|---|---|
| 2021 | EUR 247.575 |
| 2022 | EUR 290.888 |
| 2023 | EUR 331.423 |
| 2024 | EUR 335.119 |
| 2025 | EUR 349.940 |
Hoger
3.250
Praktisch
4.680
Middelbaar
6.820
Europa
1.225
Nederland
14.325
Buiten Europa
4.660
Label A
2.482
Label C
2.439
Label B
1.558
Label G
498
Label D
466
Label A+++
446
Label F
333
Label A++++
266
Label E
233
Label A+
199
Label A++
99
Label A+++++
3
| Year | Gas (m3) | Electricity (kWh) |
|---|---|---|
| 2020 | 1.090 | 2.700 |
| 2021 | 1.159 | 2.715 |
| 2022 | 879 | 2.560 |
| 2023 | 747 | 2.419 |
| 2024 | 713 | 2.464 |
Hoekwoning
Gas: 817 • Electricity: 2.562
Huurwoning
Gas: 689 • Electricity: 1.923
Koopwoning
Gas: 774 • Electricity: 2.882
Appartement
Gas: 546 • Electricity: 1.679
Tussenwoning
Gas: 729 • Electricity: 2.486
Vrijstaande woning
Gas: 1.116 • Electricity: 3.682
Twee-onder-één-kap woning
Gas: 982 • Electricity: 3.252
Total number of company establishments: 2.330
| Period | Crimes |
|---|---|
| jan 2026 | 49 |
| jul 2025 | 56 |
| jun 2025 | 47 |
| mei 2025 | 52 |
| mrt 2025 | 53 |
| mrt 2026 | 41 |
| nov 2024 | 39 |
| nov 2025 | 45 |
| okt 2024 | 43 |
| okt 2025 | 61 |
| sep 2024 | 51 |
| sep 2025 | 38 |
These figures give an indicative picture of safety trends in the living environment of Leerdam.
Short answers based on current local statistics, handy for a quick comparison of the living environment.
Leerdam telt in 2025 ongeveer 20.230 inwoners.
De gemiddelde WOZ-waarde in Leerdam is in 2025 circa € 349.940.
Het gemiddelde inkomen per inwoner in Leerdam ligt rond € 26.431 per jaar.
Voor het huidige jaar gaat het om ongeveer 584 geregistreerde misdrijven. Gebruik deze cijfers als indicatie en vergelijk trends per periode.
In Leerdam komt vooral "Tussenwoningen" veel voor, met ongeveer 3.404 woningen.
View more homes in this location.

4141CC Leerdam
€ 385.000 k.k.
4143VE Leerdam
€ 695.000 k.k.
4141MS Leerdam
€ 425.000 k.k.
4141MN Leerdam
€ 600.000 k.k.

4141AW Leerdam
€ 320.000 k.k.

4141BD Leerdam
€ 315.000 k.k.

4141AW Leerdam
€ 279.000 k.k.
4141EV Leerdam
€ 345.000 k.k.
