
Residents
31.640
Last year: 2025
3861AP Nijkerk • Gelderland
€ 425.000 k.k.
Cost of copper (estimated): € 10.350
2% transfer tax (€ 8.500) + notary (€ 1.150) + valuation (€ 700)
Total incl. VAT: € 435.350
Purchase price /m²: € 4.829
For this property, no detailed description is available yet.
€ 425.000
Cost of copper (estimated): € 10.350
2% transfer tax (€ 8.500) + notary (€ 1.150) + valuation (€ 700)
Total purchase (incl. p.p.): € 435.350
3,19%
Yearly
€ 21.250
Direct available
Estimated mortgage
Indicative gross monthly cost
Based on annuity and 30 year term
Indicative net monthly cost
iDisclaimer: this mortgage calculation is a simplified indication based on general assumptions. No rights can be derived from the results shown. Calculated with 10-annual interest (met NHG), automatically determined based on the price limit € 470.000. Source: 10-jaars rente uit mortgage_rates (15-06-2026 03:45).
Douche, ligbad, en wastafel
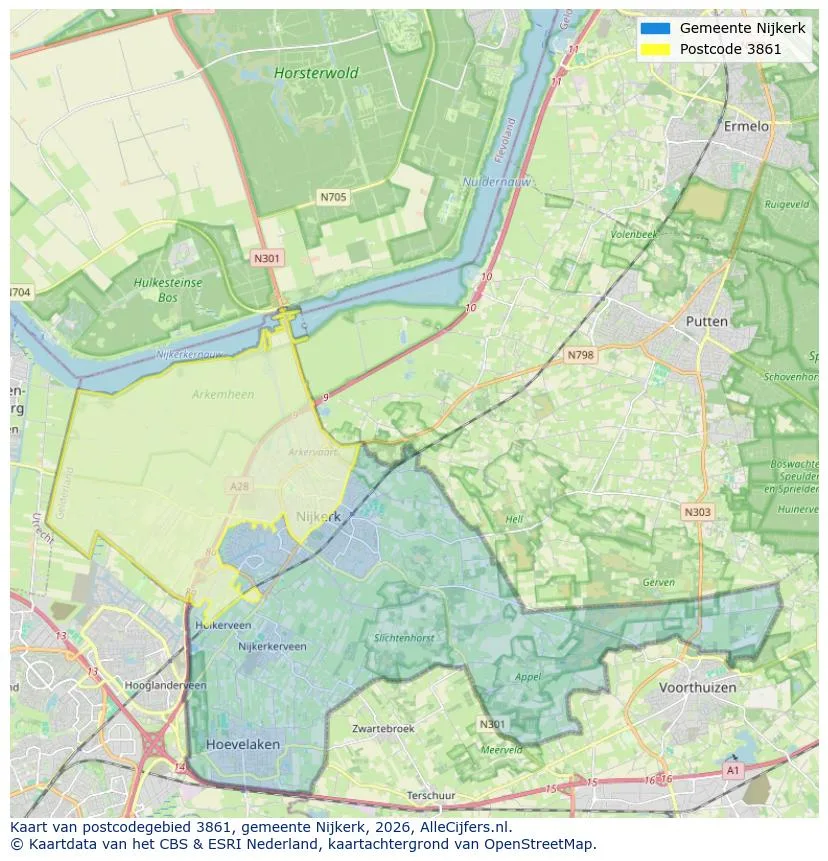
Spatial overview of the work area in Nijkerk
View current location data on residents, WOZ development, housing stock, energy consumption, business activity and safety in Nijkerk. In 2025 were there 31.640 residents. The average WOZ value in 2025 is EUR 468.307.
Residents
31.640
Last year: 2025
Average WOZ
EUR 468.307
Last year: 2025
Average income per person.
EUR 29.548
Source: AllNumbers
Crimes (current year)
850
Total registered
| Year | Residents |
|---|---|
| 2021 | 29.910 |
| 2022 | 30.360 |
| 2023 | 30.935 |
| 2024 | 31.340 |
| 2025 | 31.640 |
| Year | Average WOZ |
|---|---|
| 2021 | EUR 339.420 |
| 2022 | EUR 367.729 |
| 2023 | EUR 421.236 |
| 2024 | EUR 448.170 |
| 2025 | EUR 468.307 |
Hoger
6.740
Praktisch
6.470
Middelbaar
9.820
Europa
1.710
Nederland
26.340
Buiten Europa
3.600
Label A
4.322
Label C
3.254
Label B
2.133
Label D
899
Label G
653
Label A+++
648
Label F
537
Label E
390
Label A+
324
Label A++
255
Label A++++
187
Label A+++++
14
| Year | Gas (m3) | Electricity (kWh) |
|---|---|---|
| 2020 | 1.201 | 2.974 |
| 2021 | 1.361 | 3.021 |
| 2022 | 1.068 | 2.860 |
| 2023 | 888 | 2.700 |
| 2024 | 852 | 2.774 |
Hoekwoning
Gas: 929 • Electricity: 2.760
Huurwoning
Gas: 739 • Electricity: 2.054
Koopwoning
Gas: 963 • Electricity: 3.016
Appartement
Gas: 625 • Electricity: 1.825
Tussenwoning
Gas: 798 • Electricity: 2.455
Vrijstaande woning
Gas: 1.371 • Electricity: 4.001
Twee-onder-één-kap woning
Gas: 1.034 • Electricity: 3.327
Total number of company establishments: 4.645
| Period | Crimes |
|---|---|
| jan 2026 | 72 |
| jul 2025 | 72 |
| jun 2025 | 61 |
| mei 2025 | 76 |
| mrt 2025 | 64 |
| mrt 2026 | 69 |
| nov 2024 | 65 |
| nov 2025 | 78 |
| okt 2024 | 78 |
| okt 2025 | 66 |
| sep 2024 | 92 |
| sep 2025 | 73 |
These figures give an indicative picture of safety trends in the living environment of Nijkerk.
Short answers based on current local statistics, handy for a quick comparison of the living environment.
Nijkerk telt in 2025 ongeveer 31.640 inwoners.
De gemiddelde WOZ-waarde in Nijkerk is in 2025 circa € 468.307.
Het gemiddelde inkomen per inwoner in Nijkerk ligt rond € 29.548 per jaar.
Voor het huidige jaar gaat het om ongeveer 850 geregistreerde misdrijven. Gebruik deze cijfers als indicatie en vergelijk trends per periode.
In Nijkerk komt vooral "Tussenwoningen" veel voor, met ongeveer 4.809 woningen.
View more homes in this location.
3862LN Nijkerk
€ 519.000 k.k.
€ 4.718/m²

3861EW Nijkerk
€ 419.000 k.k.

3861LJ Nijkerk
€ 475.000 k.k.
€ 4.130/m²

3861MZ Nijkerk
€ 499.000 k.k.

3862DG Nijkerk
€ 479.500 k.k.
€ 5.511/m²

3862HB Nijkerk
€ 415.000 k.k.
€ 5.321/m²

3862EV Nijkerk
€ 595.000 k.k.
€ 3.628/m²

3862JG Nijkerk
€ 669.000 k.k.
€ 4.520/m²
