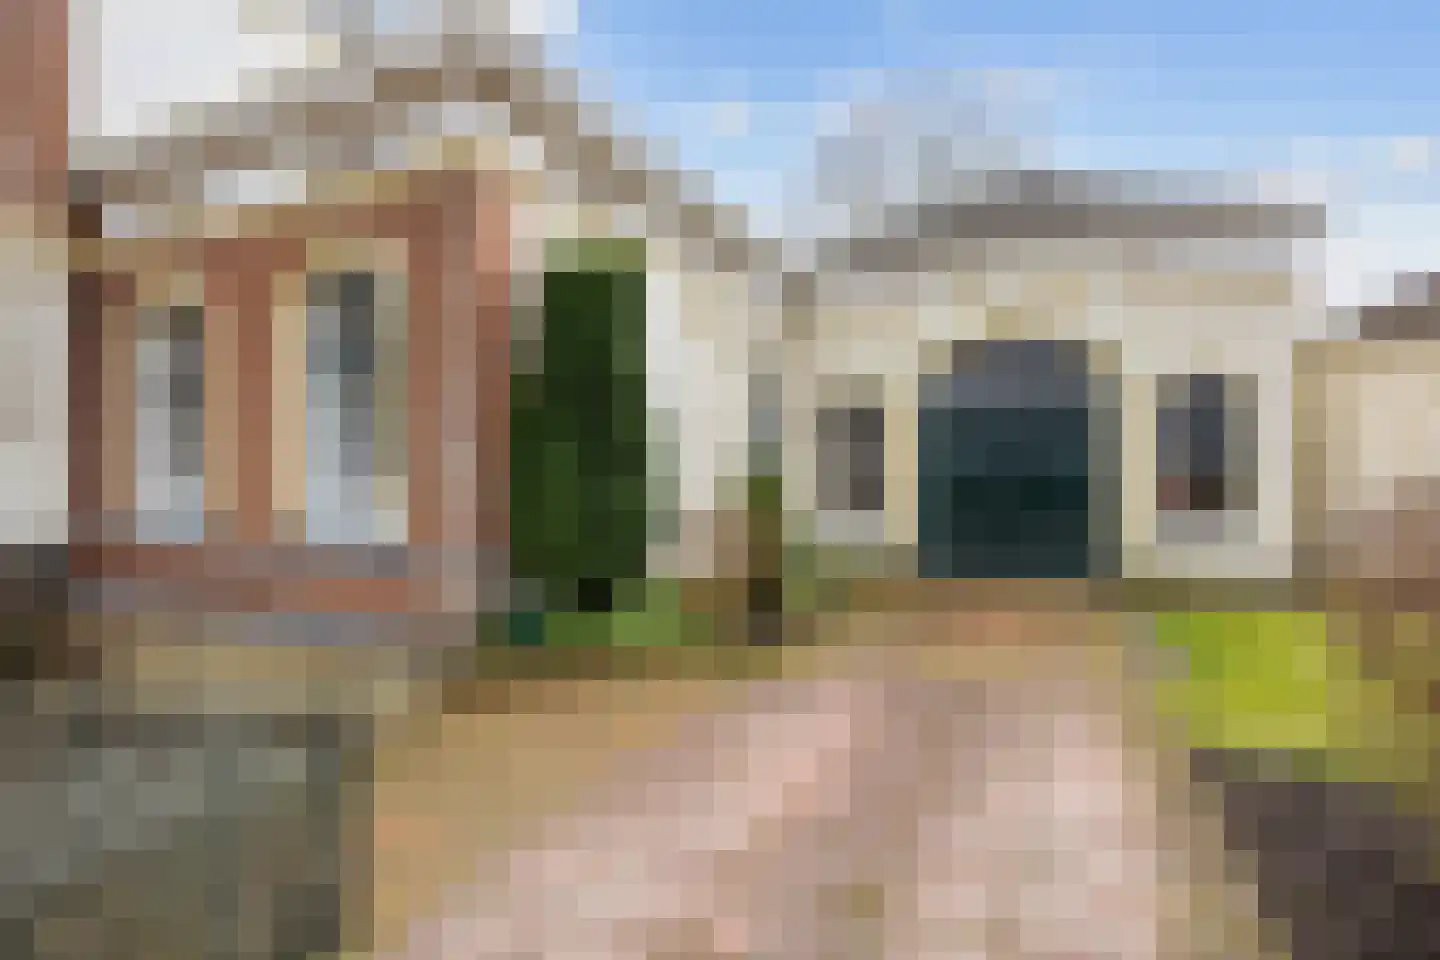
- Sold
Boterdiep Oz 2
9959PM Onderdendam
€ 649.000 k.k.
€ 2.565/m²
- Living area
- 253 m²
- Land area
- 2820 m²
- Bedrooms
- 6
Searching in 4 houses in Onderdendam
Type to search. Use arrow down and arrow up to navigate through results and press Enter to open.
Hidden search suggestions.
View current properties in Onderdendam or search targeted on street, postal code and property characteristics.
View the current housing stock in Onderdendam and quickly filter by price, living area, rooms and more. There are currently 4 houses in this place within our selection.
9959PM Onderdendam
€ 649.000 k.k.
€ 2.565/m²
9959TC Onderdendam
€ 285.000 k.k.
€ 2.522/m²
9959PE Onderdendam
€ 284.900 k.k.
€ 3.903/m²
9959PN Onderdendam
€ 230.000 k.k.
€ 2.017/m²
Get free quotes from real estate agents with local market knowledge. Compare more than 19 real estate agents in Onderdendam.
Selling a home in Onderdendam? Compare all real estate agents in Onderdendam or view the top 10 real estate agents in Onderdendam for extra context for your choice.
Real estate agents make sharper offers when they know you're comparing — ask for quotes for sale or purchase.
Practical answers about housing supply, sales and comparing real estate agents in Onderdendam.
The costs of a real estate agent in Onderdendam depend on commission, setup costs, property presentation and the chosen service. Compare the 19 real estate agents in Onderdendam via the real estate agent page and request multiple quotes to compare rates and approach well.
Within our selection, we are currently showing 4 houses in Onderdendam. View also the sold houses in Onderdendam to compare the current offering with recent transactions.
Take into account not only price and living area but also maintenance, energy label, location, outdoor space and sales status. This way you compare houses in Onderdendam on more than just the asking price.
A local real estate agent knows the neighborhoods, recent transactions and demand in Onderdendam. By comparing 19 real estate agents in the region you get a better insight into prices, sales strategy and expected yield; the top 10 in Onderdendam provides a useful starting point.
Yes, when making a sales plan, a valuation in Onderdendam is wise. You gain insight into a realistic asking price and can then compare offers from real estate agents specifically.
View current location data on residents, WOZ development, housing stock, energy consumption, business activity and safety in Onderdendam. In 2025 were there 601 residents. The average WOZ value in 2025 is EUR 317.420.
These figures help to better assess and compare the housing stock in Onderdendam with recent sold homes. Orient yourself then on suitable top real estate agents in Onderdendam for sales advice in this region.
Residents
601
Last year: 2025
Average WOZ
EUR 317.420
Last year: 2025
Average income per person.
EUR 31.026
Source: AllNumbers
Crimes (current year)
18
Total registered
| Year | Residents |
|---|---|
| 2021 | 589 |
| 2022 | 594 |
| 2023 | 576 |
| 2024 | 600 |
| 2025 | 601 |
| Year | Average WOZ |
|---|---|
| 2021 | EUR 211.556 |
| 2022 | EUR 244.699 |
| 2023 | EUR 284.736 |
| 2024 | EUR 293.811 |
| 2025 | EUR 317.420 |
Hoger
117
Praktisch
106
Middelbaar
238
Europa
24
Nederland
553
Buiten Europa
23
Label G
121
Label D
43
Label C
37
Label F
23
Label A
21
Label B
15
Label E
15
Label A+
7
Label A+++
2
Label A++
0
Label A++++
0
Label A+++++
0
| Year | Gas (m3) | Electricity (kWh) |
|---|---|---|
| 2020 | 1.626 | 2.734 |
| 2021 | 1.855 | 2.858 |
| 2022 | 1.534 | 2.878 |
| 2023 | 1.234 | 2.640 |
| 2024 | 1.188 | 2.834 |
Hoekwoning
Gas: 852 • Electricity: 1.663
Huurwoning
Gas: 1.136 • Electricity: 2.094
Koopwoning
Gas: 1.262 • Electricity: 2.779
Appartement
Gas: 1.429 • Electricity: 2.357
Tussenwoning
Gas: 794 • Electricity: 1.421
Vrijstaande woning
Gas: 1.311 • Electricity: 2.952
Twee-onder-één-kap woning
Gas: 936 • Electricity: 1.822
Total number of company establishments: 88
| Period | Crimes |
|---|---|
| jan 2025 | 5 |
| jan 2026 | 1 |
| jul 2025 | 2 |
| jun 2025 | 0 |
| mei 2025 | 2 |
| mrt 2025 | 2 |
| nov 2024 | 0 |
| nov 2025 | 0 |
| okt 2024 | 1 |
| okt 2025 | 0 |
| sep 2024 | 0 |
| sep 2025 | 0 |
These figures give an indicative picture of safety trends in the living environment of Onderdendam.
Short answers based on current local statistics, handy for a quick comparison of the living environment.
Onderdendam telt in 2025 ongeveer 601 inwoners.
De gemiddelde WOZ-waarde in Onderdendam is in 2025 circa € 317.420.
Het gemiddelde inkomen per inwoner in Onderdendam ligt rond € 31.026 per jaar.
Voor het huidige jaar gaat het om ongeveer 18 geregistreerde misdrijven. Gebruik deze cijfers als indicatie en vergelijk trends per periode.
In Onderdendam komt vooral "Vrijstaande woningen" veel voor, met ongeveer 151 woningen.