
Residents
25.065
Last year: 2025
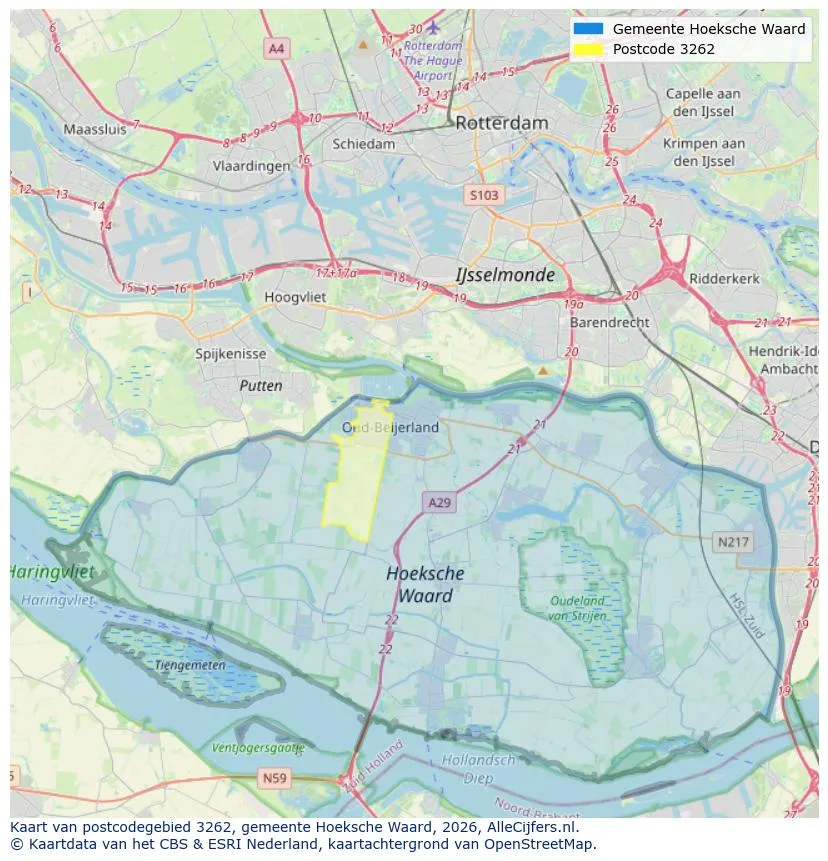
3262CL Oud-Beijerland • Zuid-Holland
For this property, no detailed description is available yet.
Discover where agents are active in Oud-Beijerland
View current location data on residents, WOZ development, housing stock, energy consumption, business activity and safety in Oud-Beijerland. In 2025 were there 25.065 residents. The average WOZ value in 2025 is EUR 397.000.
Residents
25.065
Last year: 2025
Average WOZ
EUR 397.000
Last year: 2025
Average income per person.
EUR 36.200
Source: AllNumbers
Crimes (current year)
728
Total registered
| Year | Residents |
|---|---|
| 2021 | 24.665 |
| 2022 | 24.825 |
| 2023 | 24.895 |
| 2024 | 24.860 |
| 2025 | 25.065 |
| Year | Average WOZ |
|---|---|
| 2021 | EUR 285.000 |
| 2022 | EUR 314.000 |
| 2023 | EUR 364.000 |
| 2024 | EUR 379.000 |
| 2025 | EUR 397.000 |
Hoger
5.810
Praktisch
4.300
Middelbaar
8.110
Europa
1.175
Nederland
21.710
Buiten Europa
2.180
Label C
3.856
Label A
2.763
Label B
1.928
Label D
853
Label G
574
Label E
449
Label F
374
Label A+++
282
Label A+
248
Label A++
94
Label A++++
77
Label A+++++
7
| Year | Gas (m3) | Electricity (kWh) |
|---|---|---|
| 2020 | 1.080 | 2.950 |
| 2021 | 1.210 | 3.030 |
| 2022 | 920 | 2.800 |
| 2023 | 790 | 2.620 |
| 2024 | 760 | 2.700 |
Hoekwoning
Gas: 900 • Electricity: 2.810
Huurwoning
Gas: 640 • Electricity: 2.000
Koopwoning
Gas: 860 • Electricity: 2.920
Appartement
Gas: 530 • Electricity: 1.940
Tussenwoning
Gas: 750 • Electricity: 2.540
Vrijstaande woning
Gas: 1.290 • Electricity: 4.240
Twee-onder-één-kap woning
Gas: 1.050 • Electricity: 3.250
Total number of company establishments: 3.325
| Period | Crimes |
|---|---|
| jan 2025 | 65 |
| jan 2026 | 63 |
| jul 2025 | 62 |
| jun 2025 | 85 |
| mei 2025 | 46 |
| mrt 2025 | 74 |
| nov 2024 | 54 |
| nov 2025 | 59 |
| okt 2024 | 65 |
| okt 2025 | 68 |
| sep 2024 | 52 |
| sep 2025 | 53 |
These figures give an indicative picture of safety trends in the living environment of Oud-Beijerland.
Short answers based on current local statistics, handy for a quick comparison of the living environment.
Oud-Beijerland telt in 2025 ongeveer 25.065 inwoners.
De gemiddelde WOZ-waarde in Oud-Beijerland is in 2025 circa € 397.000.
Het gemiddelde inkomen per inwoner in Oud-Beijerland ligt rond € 36.200 per jaar.
Voor het huidige jaar gaat het om ongeveer 728 geregistreerde misdrijven. Gebruik deze cijfers als indicatie en vergelijk trends per periode.
In Oud-Beijerland komt vooral "Tussenwoningen" veel voor, met ongeveer 4.792 woningen.
View more homes in this location.
3263NB Oud-Beijerland
€ 439.000 k.k.

3261RC Oud-Beijerland
€ 399.500 k.k.

3263AD Oud-Beijerland
€ 438.500 k.k.
€ 4.137/m²
3262NC Oud-Beijerland
€ 575.000 k.k.
€ 4.713/m²

3263RG Oud-Beijerland
€ 425.000 k.k.
€ 3.864/m²

3262AR Oud-Beijerland
€ 525.000 k.k.
€ 6.250/m²
3261XB Oud-Beijerland
€ 375.000 k.k.
€ 3.024/m²

3261EK Oud-Beijerland
€ 350.000 k.k.
€ 4.375/m²
