Residents
4.602
Last year: 2026
6451CT Schinveld • Limburg
€ 1.195.000 k.k.
Cost of copper (estimated): € 25.750
2% transfer tax (€ 23.900) + notary (€ 1.150) + valuation (€ 700)
Total incl. VAT: € 1.220.750
Purchase price /m²: € 887
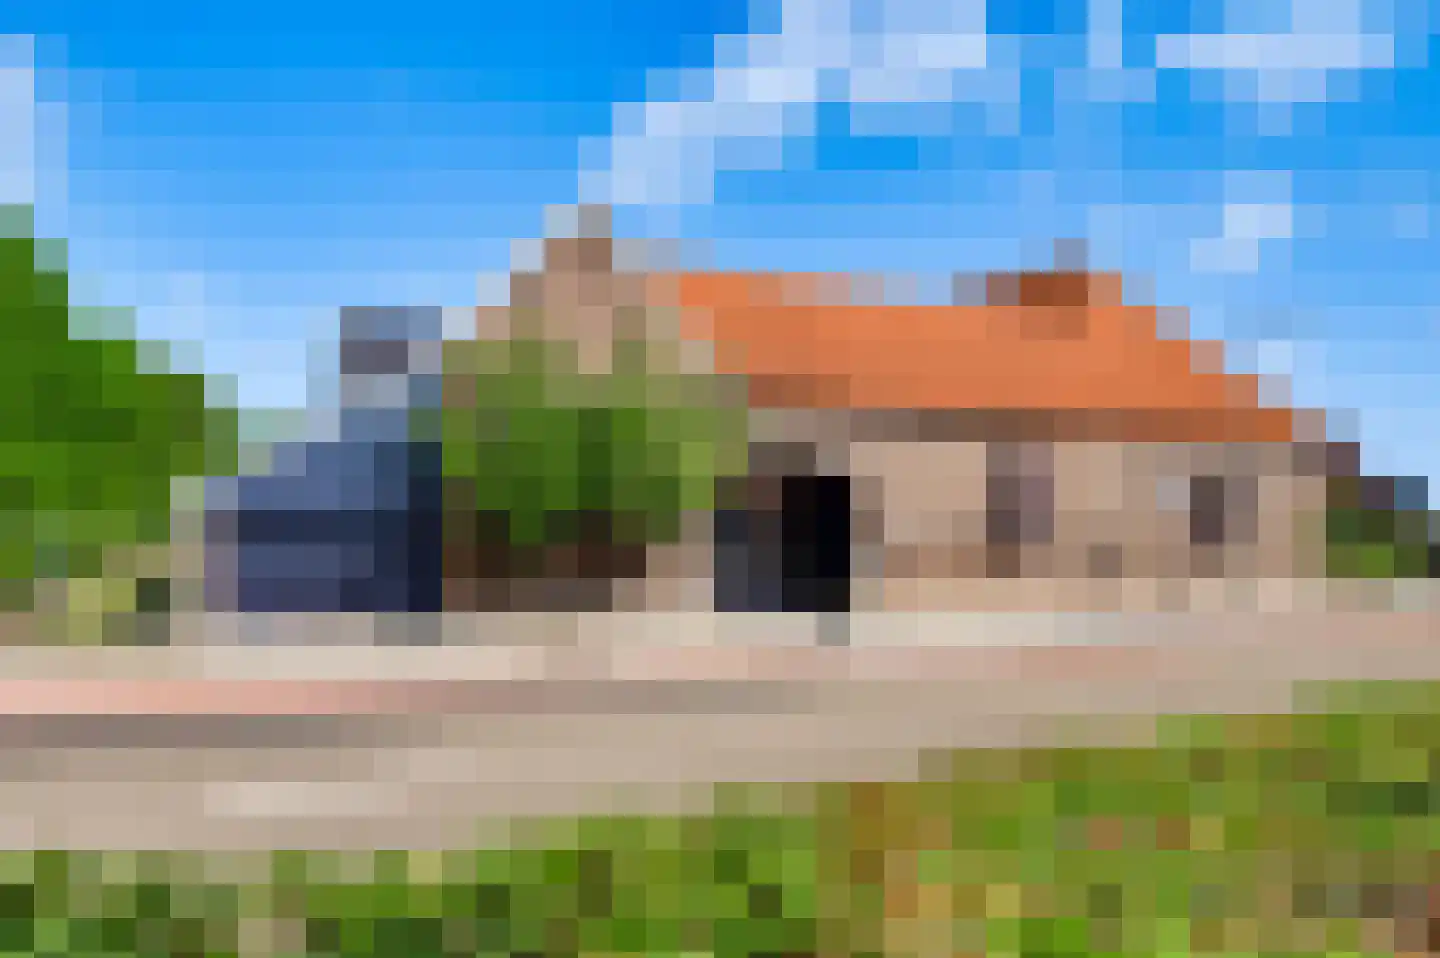
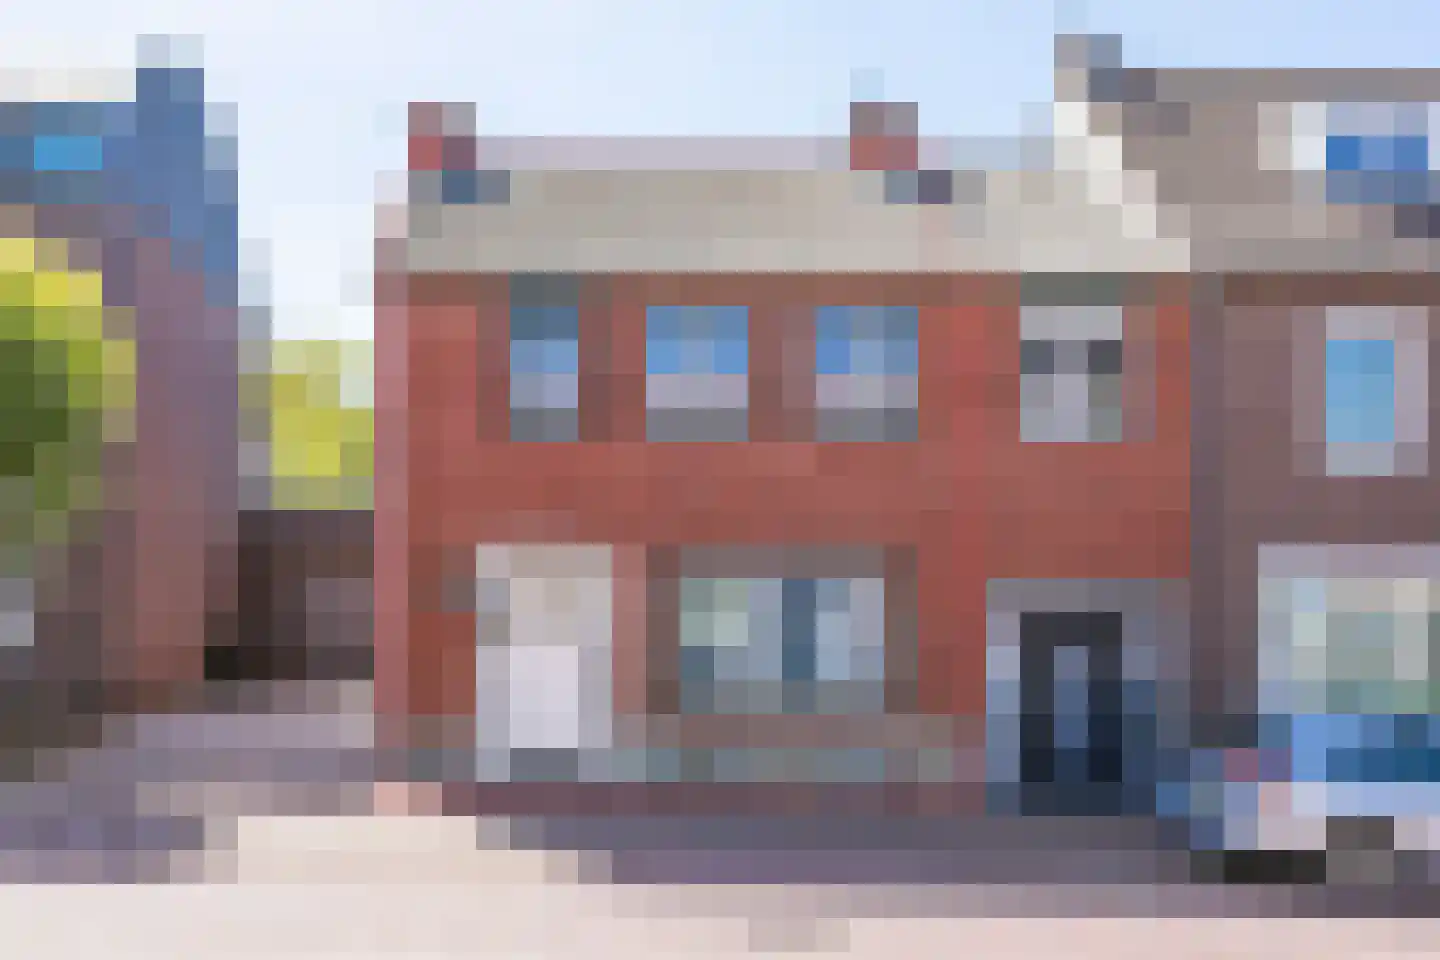
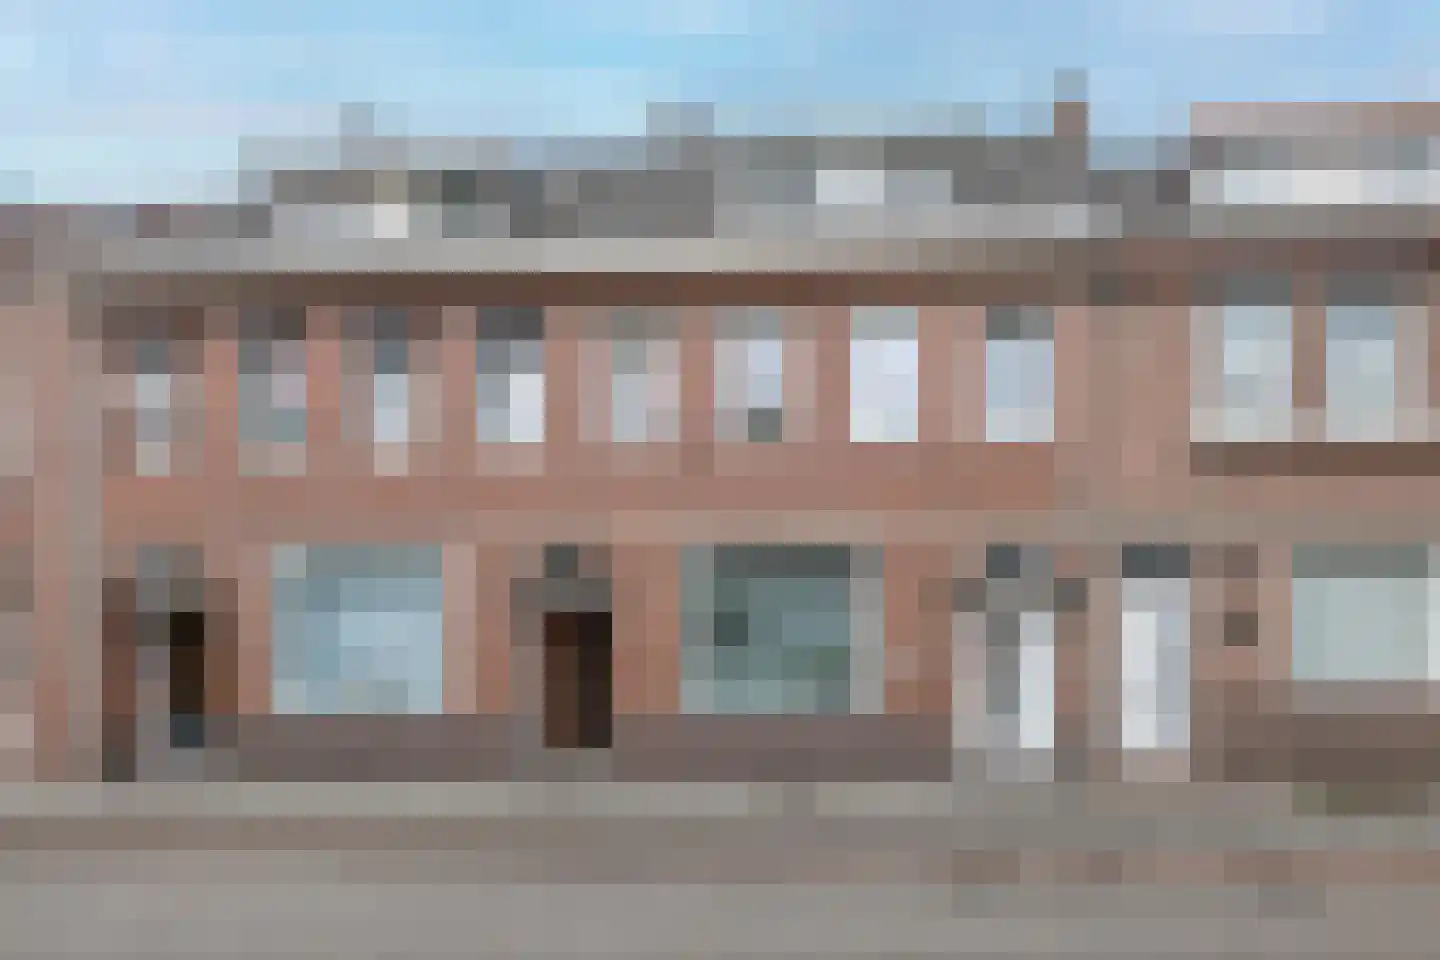
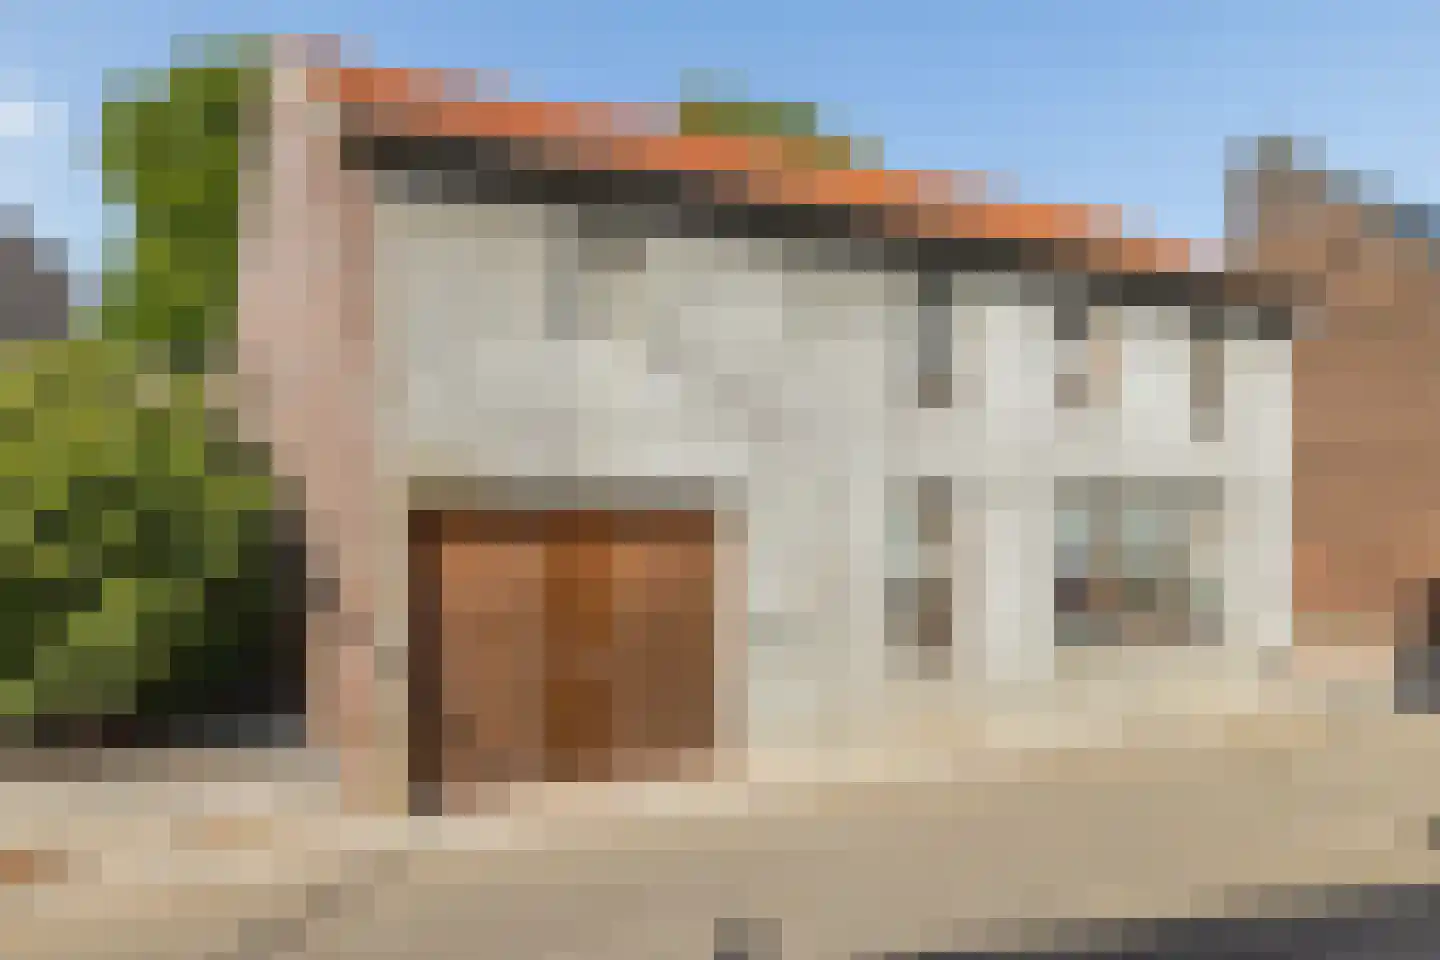
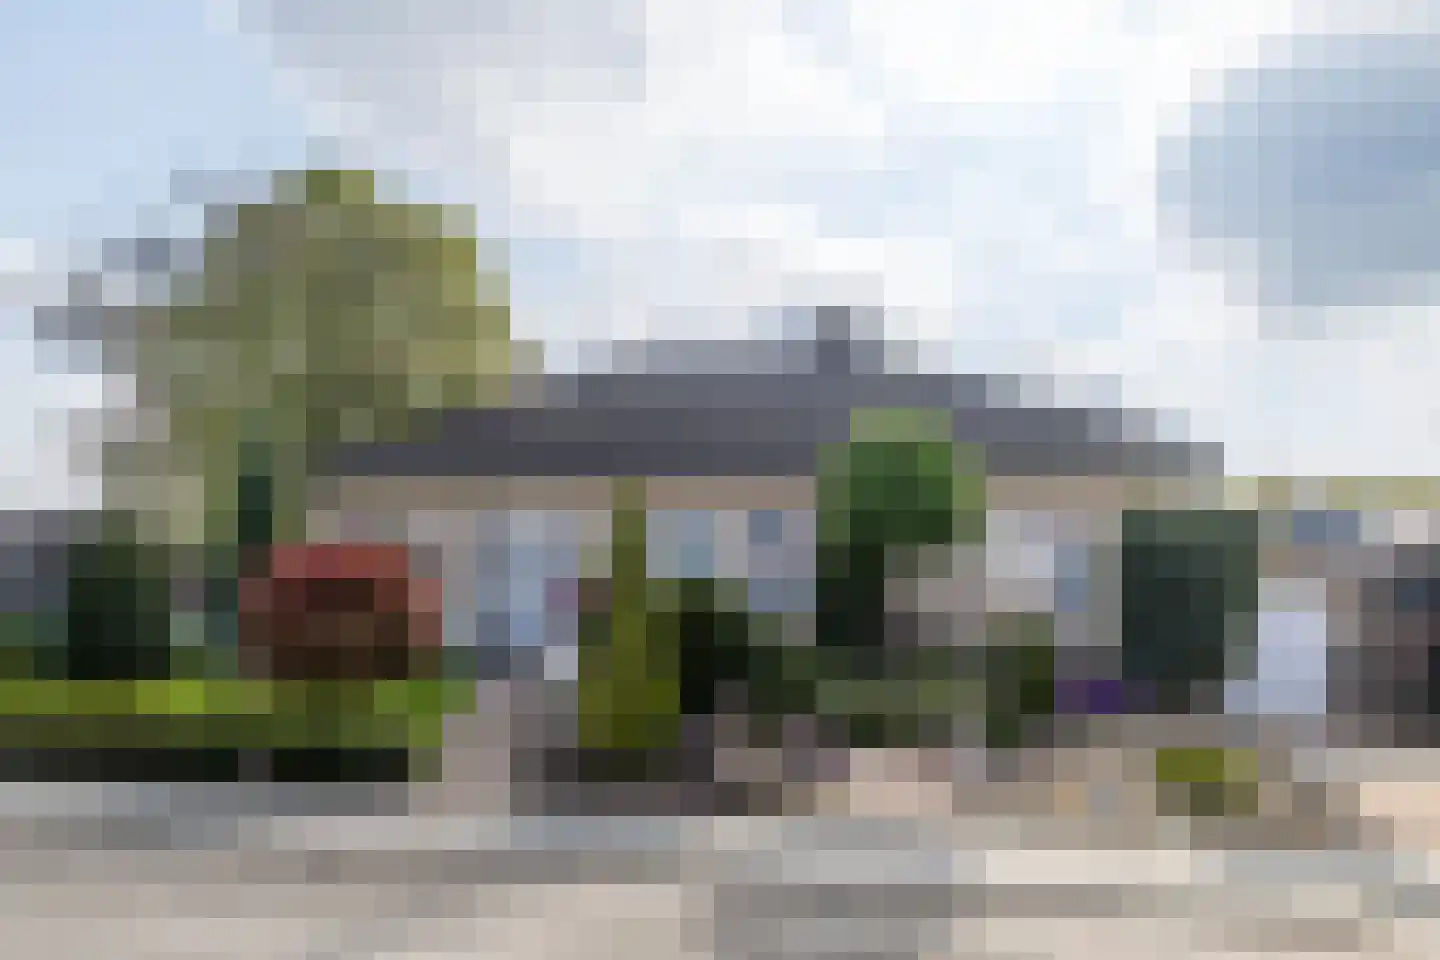
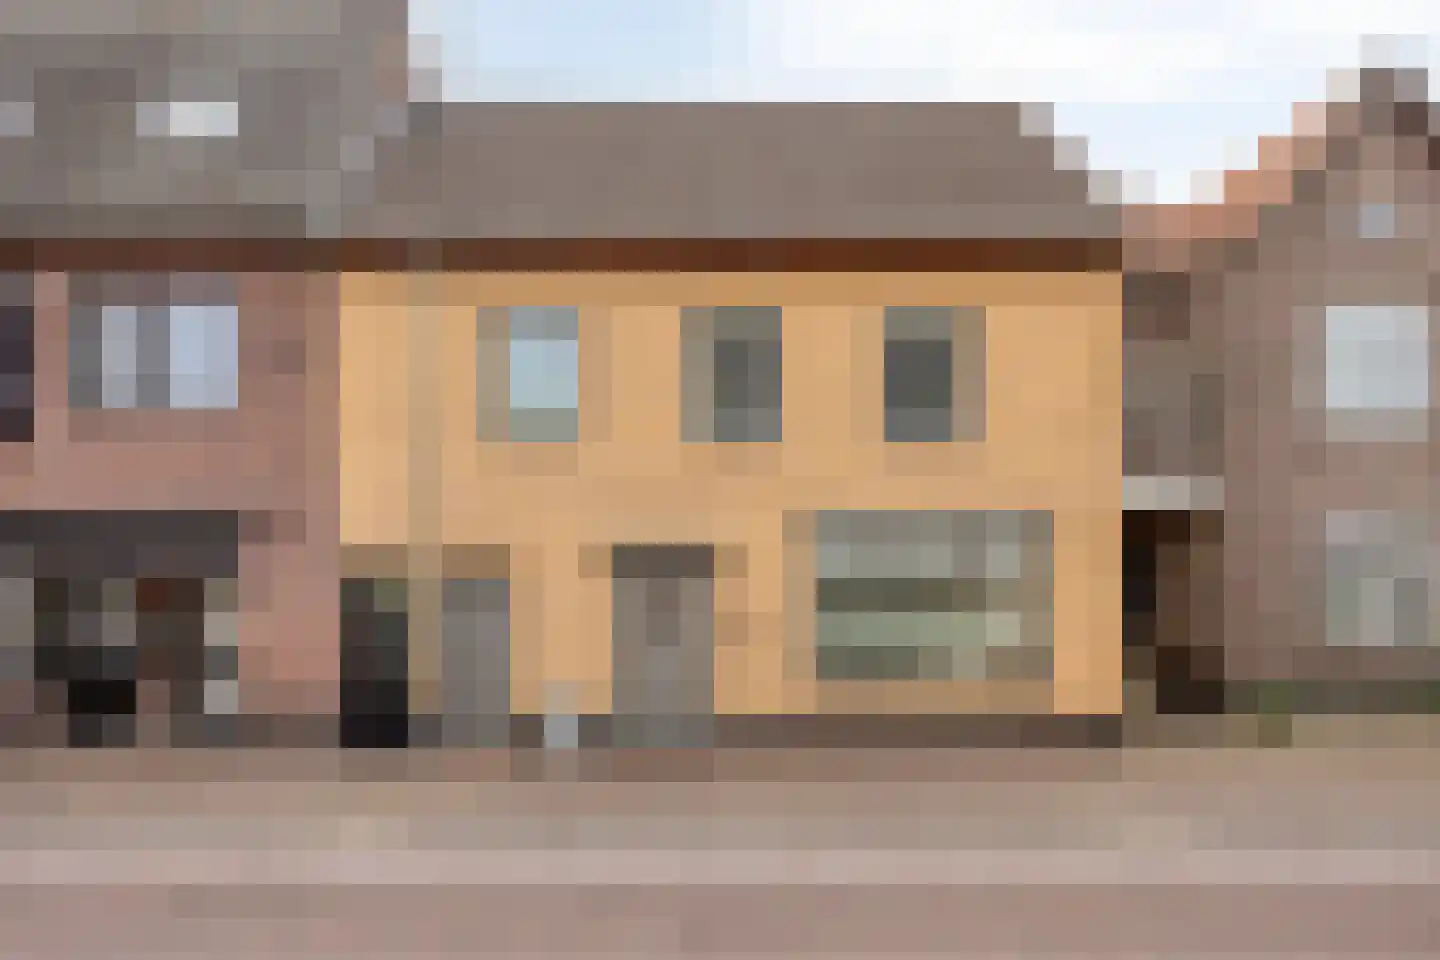
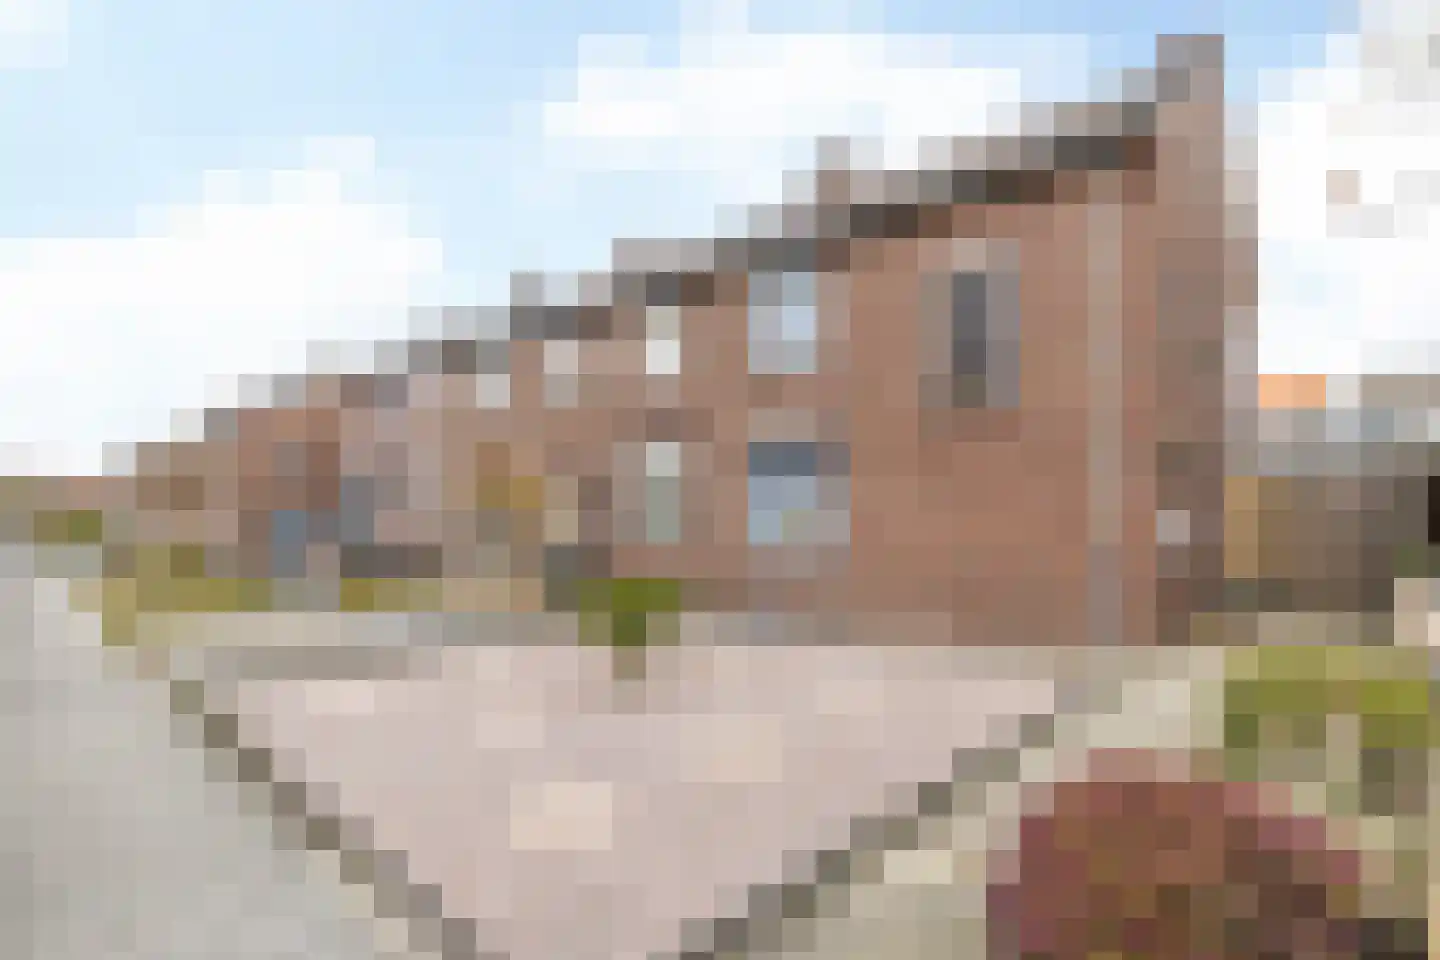
Brunssummerstraat 46 in Schinveld biedt een bijzondere kans met Hoeve de Duiker: een monumentale carréboerderij uit 1706 die tot drie zelfstandige woningen gesplitst kan worden. Omgeven door groene bossen en natuur, is deze hoeve niet alleen geschikt voor sfeervol wonen maar biedt ook ruimte voor mantelzorg of combinaties van wonen en werken. Met een perceel van 2740 m² en de mogelijkheid om gebruik te maken van de huidige bedrijfswoning, opslagruimte en andere gebouwen, is deze historische plek uniek in het groene Zuid-Limburgse Schinveld.
€ 1.195.000
Cost of copper (estimated): € 25.750
2% transfer tax (€ 23.900) + notary (€ 1.150) + valuation (€ 700)
Total purchase (incl. p.p.): € 1.220.750
3,04%
Yearly
€ 59.750
Direct available
Estimated mortgage
Indicative gross monthly cost
Based on annuity and 30 year term
Indicative net monthly cost
iDisclaimer: this mortgage calculation is a simplified indication based on general assumptions. No rights can be derived from the results shown. Calculated with 10-annual interest (zonder NHG), automatically determined based on the price limit € 470.000. Source: 10-jaars rente uit mortgage_rates (05-05-2026 03:45). For non-NHG, an 80% mortgage of the market value has been used in this indication.
Sauna en 2 toiletten
Elektra
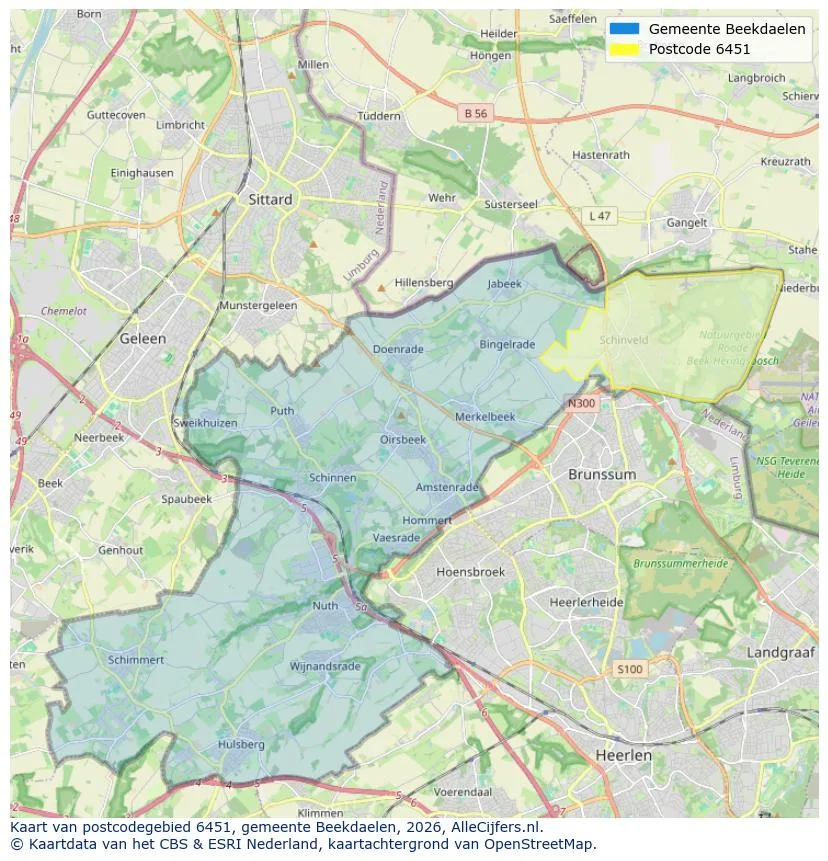
Discover where agents are active in Schinveld
View current location data on residents, WOZ development, housing stock, energy consumption, business activity and safety in Schinveld. In 2026 were there 4.602 residents. The average WOZ value in 2025 is EUR 269.445.
Residents
4.602
Last year: 2026
Average WOZ
EUR 269.445
Last year: 2025
Average income per person.
EUR 30.536
Source: AllNumbers
Crimes (current year)
206
Total registered
| Year | Residents |
|---|---|
| 2021 | 4.630 |
| 2022 | 4.650 |
| 2023 | 4.705 |
| 2024 | 4.680 |
| 2025 | 4.650 |
| 2026 | 4.602 |
| Year | Average WOZ |
|---|---|
| 2021 | EUR 203.855 |
| 2022 | EUR 218.727 |
| 2023 | EUR 249.620 |
| 2024 | EUR 251.509 |
| 2025 | EUR 269.445 |
Hoger
770
Praktisch
1.070
Middelbaar
1.580
Europa
800
Nederland
3.545
Buiten Europa
310
Label C
531
Label D
350
Label F
308
Label B
301
Label G
255
Label E
212
Label A
201
Label A+
8
Label A++
3
Label A+++
3
Label A++++
1
Label A+++++
0
| Year | Gas (m3) | Electricity (kWh) |
|---|---|---|
| 2020 | 1.459 | 3.114 |
| 2021 | 1.641 | 3.188 |
| 2022 | 1.277 | 3.027 |
| 2023 | 1.044 | 2.952 |
| 2024 | 1.004 | 3.004 |
Hoekwoning
Gas: 1.028 • Electricity: 2.965
Huurwoning
Gas: 948 • Electricity: 2.328
Koopwoning
Gas: 1.082 • Electricity: 3.211
Appartement
Gas: 763 • Electricity: 1.869
Tussenwoning
Gas: 969 • Electricity: 2.809
Vrijstaande woning
Gas: 1.279 • Electricity: 3.730
Twee-onder-één-kap woning
Gas: 1.067 • Electricity: 2.907
Total number of company establishments: 440
| Period | Crimes |
|---|---|
| jan 2026 | 13 |
| jul 2025 | 11 |
| jun 2025 | 11 |
| mei 2025 | 21 |
| mrt 2025 | 17 |
| mrt 2026 | 11 |
| nov 2024 | 28 |
| nov 2025 | 15 |
| okt 2024 | 13 |
| okt 2025 | 25 |
| sep 2024 | 18 |
| sep 2025 | 17 |
These figures give an indicative picture of safety trends in the living environment of Schinveld.
Short answers based on current local statistics, handy for a quick comparison of the living environment.
Schinveld telt in 2026 ongeveer 4.602 inwoners.
De gemiddelde WOZ-waarde in Schinveld is in 2025 circa € 269.445.
Het gemiddelde inkomen per inwoner in Schinveld ligt rond € 30.536 per jaar.
Voor het huidige jaar gaat het om ongeveer 206 geregistreerde misdrijven. Gebruik deze cijfers als indicatie en vergelijk trends per periode.
In Schinveld komt vooral "Tussenwoningen" veel voor, met ongeveer 607 woningen.
View more homes in this location.
6451ER Schinveld
€ 275.000 k.k.
6451AA Schinveld
€ 295.000 k.k.
€ 1.844/m²
6451CM Schinveld
€ 239.000 k.k.
€ 2.213/m²
6451HP Schinveld
€ 525.000 k.k.
€ 4.861/m²
6451CC Schinveld
€ 335.000 k.k.
€ 2.055/m²
6451EC Schinveld
€ 235.000 k.k.
€ 3.052/m²
6451PH Schinveld
€ 389.000 k.k.
€ 2.329/m²
6451CC Schinveld
€ 235.000 k.k.
€ 3.456/m²
