
Residents
3.427
Last year: 2026
6077CH Sint Odiliënberg • Limburg
€ 329.500 k.k.
Cost of copper (estimated): € 8.440
2% transfer tax (€ 6.590) + notary (€ 1.150) + valuation (€ 700)
Total incl. VAT: € 337.940
For this property, no detailed description is available yet.
€ 329.500
Cost of copper (estimated): € 8.440
2% transfer tax (€ 6.590) + notary (€ 1.150) + valuation (€ 700)
Total purchase (incl. p.p.): € 337.940
2,78%
Yearly
€ 16.475
Direct available
Estimated mortgage
Indicative gross monthly cost
Based on annuity and 30 year term
Indicative net monthly cost
iDisclaimer: this mortgage calculation is a simplified indication based on general assumptions. No rights can be derived from the results shown. Calculated with 10-annual interest (met NHG), automatically determined based on the price limit € 470.000. Source: 10-jaars rente uit mortgage_rates (06-05-2026 03:45).
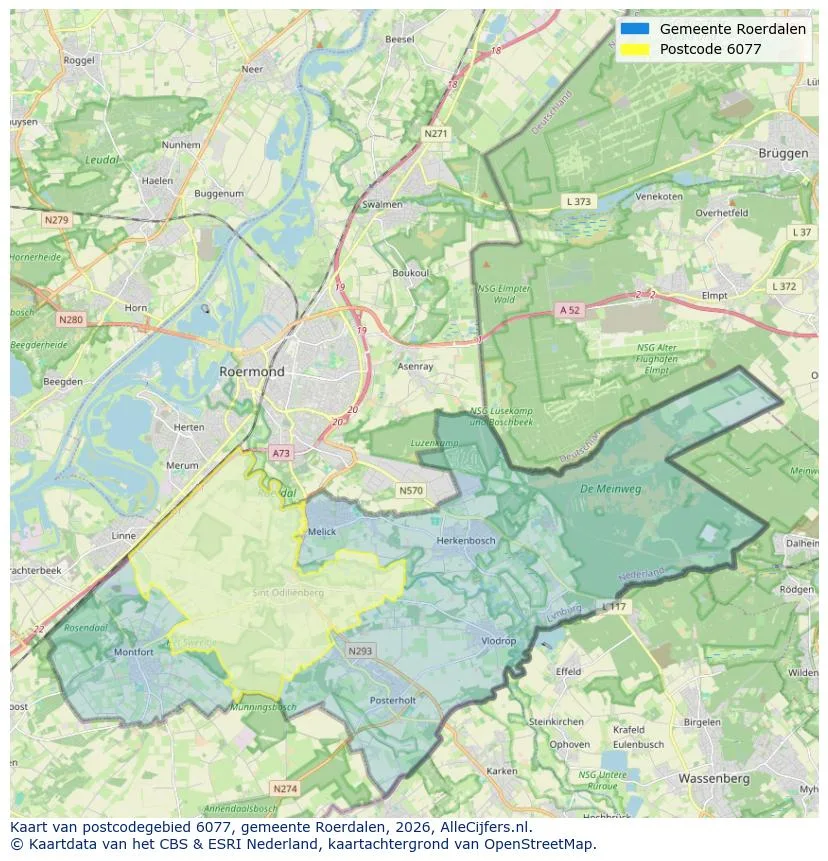
Spatial overview of the work area in Sint Odiliënberg
View current location data on residents, WOZ development, housing stock, energy consumption, business activity and safety in Sint Odiliënberg. In 2026 were there 3.427 residents. The average WOZ value in 2025 is EUR 326.000.
Residents
3.427
Last year: 2026
Average WOZ
EUR 326.000
Last year: 2025
Average income per person.
EUR 34.800
Source: AllNumbers
Crimes (current year)
118
Total registered
| Year | Residents |
|---|---|
| 2021 | 3.330 |
| 2022 | 3.355 |
| 2023 | 3.355 |
| 2024 | 3.355 |
| 2025 | 3.430 |
| 2026 | 3.427 |
| Year | Average WOZ |
|---|---|
| 2021 | EUR 242.000 |
| 2022 | EUR 262.000 |
| 2023 | EUR 306.000 |
| 2024 | EUR 306.000 |
| 2025 | EUR 326.000 |
Hoger
660
Praktisch
600
Middelbaar
1.150
Europa
445
Nederland
2.735
Buiten Europa
245
Label D
400
Label A
328
Label C
313
Label B
186
Label G
145
Label F
134
Label E
53
Label A+++
29
Label A++++
22
Label A+
9
Label A++
3
Label A+++++
0
| Year | Gas (m3) | Electricity (kWh) |
|---|---|---|
| 2020 | 1.420 | 3.020 |
| 2021 | 1.590 | 3.050 |
| 2022 | 1.200 | 2.940 |
| 2023 | 980 | 2.770 |
| 2024 | 950 | 2.900 |
Hoekwoning
Gas: 940 • Electricity: 2.630
Huurwoning
Gas: 750 • Electricity: 2.070
Koopwoning
Gas: 1.060 • Electricity: 3.010
Appartement
Gas: 640 • Electricity: 1.770
Tussenwoning
Gas: 810 • Electricity: 2.570
Vrijstaande woning
Gas: 1.270 • Electricity: 3.450
Twee-onder-één-kap woning
Gas: 910 • Electricity: 2.620
Total number of company establishments: 335
| Period | Crimes |
|---|---|
| jan 2026 | 8 |
| jul 2025 | 5 |
| jun 2025 | 5 |
| mei 2025 | 11 |
| mrt 2025 | 10 |
| mrt 2026 | 8 |
| nov 2024 | 11 |
| nov 2025 | 5 |
| okt 2024 | 9 |
| okt 2025 | 11 |
| sep 2024 | 12 |
| sep 2025 | 10 |
These figures give an indicative picture of safety trends in the living environment of Sint Odiliënberg.
Short answers based on current local statistics, handy for a quick comparison of the living environment.
Sint Odiliënberg telt in 2026 ongeveer 3.427 inwoners.
De gemiddelde WOZ-waarde in Sint Odiliënberg is in 2025 circa € 326.000.
Het gemiddelde inkomen per inwoner in Sint Odiliënberg ligt rond € 34.800 per jaar.
Voor het huidige jaar gaat het om ongeveer 118 geregistreerde misdrijven. Gebruik deze cijfers als indicatie en vergelijk trends per periode.
In Sint Odiliënberg komt vooral "Twee-onder-één-kap woningen" veel voor, met ongeveer 547 woningen.
View more homes in this location.

6077NX Sint Odiliënberg
€ 825.000 k.k.
€ 3.587/m²
6077BS Sint Odiliënberg
€ 225.000 k.k.
€ 2.446/m²
6077NK Sint Odiliënberg
€ 325.000 k.k.
€ 3.916/m²

6077GB Sint Odiliënberg
€ 325.000 k.k.
€ 3.009/m²

6077BT Sint Odiliënberg
€ 274.500 k.k.
€ 3.119/m²

6077CP Sint Odiliënberg
€ 375.000 k.k.
€ 3.440/m²
6077GT Sint Odiliënberg
€ 325.000 k.k.
€ 2.425/m²
6077GC Sint Odiliënberg
€ 289.000 k.k.
€ 2.449/m²
