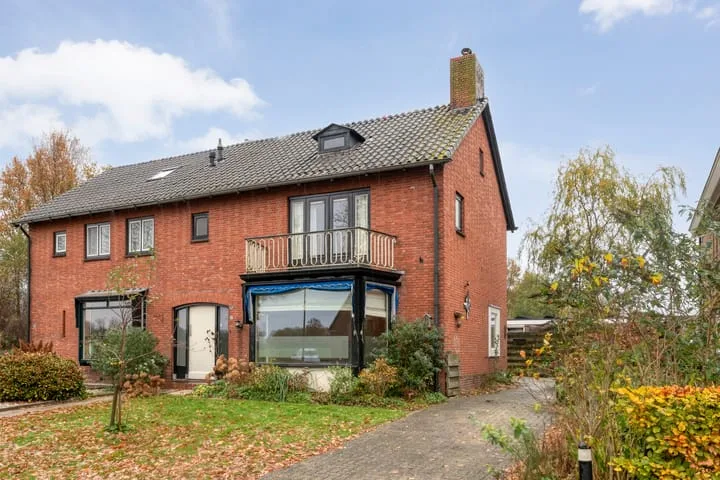
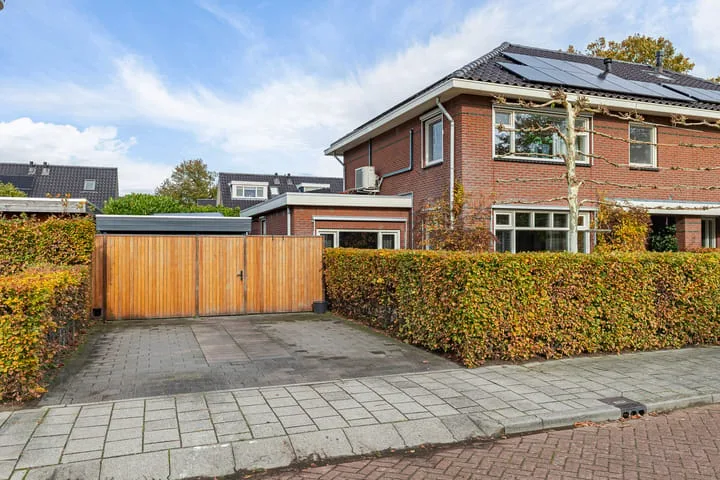
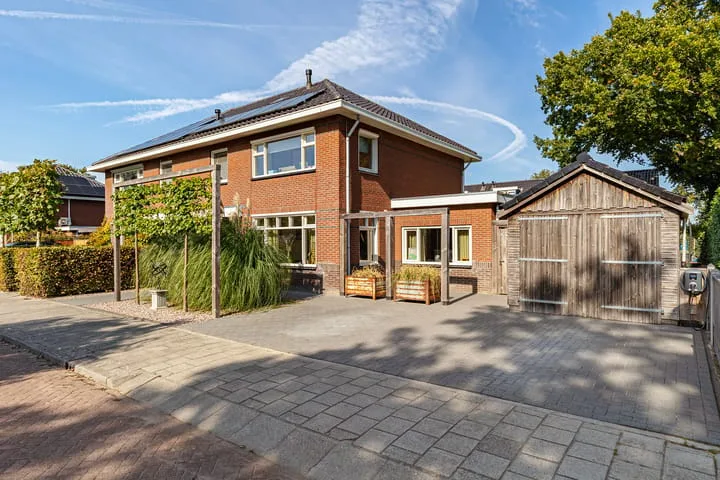
- Sold
Het Schild 3
8341RL Steenwijkerwold
€ 445.000 k.k.
€ 3.069/m²
- Living area
- 145 m²
- Land area
- 696 m²
- Bedrooms
- 5
View 13 sold houses in Steenwijkerwold
Type to search. Use arrow down and arrow up to navigate through results and press Enter to open.
Hidden search suggestions.
Compare sold homes in Steenwijkerwold or view the current offering in this location directly.
On this page you will find recently sold homes in Steenwijkerwold. Use this overview to better estimate selling prices, popular neighborhoods, and the local housing supply before you choose a real estate agent. Also view the current housing supply with 17 houses in Steenwijkerwold.
8341RL Steenwijkerwold
€ 445.000 k.k.
€ 3.069/m²
8341RJ Steenwijkerwold
€ 299.000 k.k.
€ 3.115/m²
8341NB Steenwijkerwold
€ 325.000 k.k.
€ 3.282/m²
8341PH Steenwijkerwold
€ 305.000 k.k.
€ 4.121/m²
8341SH Steenwijkerwold
€ 324.500 k.k.
€ 2.871/m²
8341NA Steenwijkerwold
€ 549.000 k.k.
€ 3.327/m²
8341NA Steenwijkerwold
€ 542.500 k.k.
€ 2.885/m²
8341PM Steenwijkerwold
€ 275.000 k.k.
€ 2.350/m²
8341PH Steenwijkerwold
€ 300.000 k.k.
€ 0/m²
8341SC Steenwijkerwold
€ 500.000 k.k.
€ 0/m²
8341SC Steenwijkerwold
€ 625.000 k.k.
€ 3.125/m²
8341SE Steenwijkerwold
€ 419.000 k.k.
€ 2.992/m²
8341SE Steenwijkerwold
€ 475.000 k.k.
€ 3.625/m²
View recent sales and receive free quotes from local real estate agents. Compare more than 16 real estate agents in Steenwijkerwold.
Selling your own home in Steenwijkerwold? Compare real estate agents in Steenwijkerwold or view the best real estate agents in Steenwijkerwold as a reference for your choice.
Real estate agents make sharper offers when they know you're comparing — ask for quotes for sale or purchase.
Short answers about housing prices, sold homes and comparing real estate agents in Steenwijkerwold.
The costs of a real estate agent in Steenwijkerwold vary per office, property type and sales approach. In Steenwijkerwold you can compare 16 real estate agents; therefore also look at the real estate agents in Steenwijkerwold to better compare fees, presentation and local experience.
On this page we currently show 13 sold houses in Steenwijkerwold from our selection. This helps you to better assess recent transactions and the local housing market.
Houses sold in Steenwijkerwold give insight into asking prices, house types and neighborhoods where recent transactions have taken place. Compare this also with the current housing stock in Steenwijkerwold to better understand the market.
You can use sold homes as a first market indication, but a local real estate agent can better take into account finishing, location, maintenance and current demand in Steenwijkerwold.
Compare the 16 real estate agents in Steenwijkerwold on local sales experience, reviews, expected yield, commission and marketing approach. View real estate agents in Steenwijkerwold or the top 10 agents in Steenwijkerwold to quickly discover strong offices.
View current location data on residents, WOZ development, housing stock, energy consumption, business activity and safety in Steenwijkerwold. In 2025 were there 1.885 residents. The average WOZ value in 2025 is EUR 318.000.
These figures help to better assess and compare the housing stock in Steenwijkerwold with recent sold homes. Orient yourself then on suitable top real estate agents in Steenwijkerwold for sales advice in this region.
Residents
1.885
Last year: 2025
Average WOZ
EUR 318.000
Last year: 2025
Average income per person.
EUR 28.600
Source: AllNumbers
Crimes (current year)
29
Total registered
| Year | Residents |
|---|---|
| 2021 | 1.905 |
| 2022 | 1.900 |
| 2023 | 1.890 |
| 2024 | 1.885 |
| 2025 | 1.885 |
| Year | Average WOZ |
|---|---|
| 2021 | EUR 236.000 |
| 2022 | EUR 254.000 |
| 2023 | EUR 289.000 |
| 2024 | EUR 303.000 |
| 2025 | EUR 318.000 |
Hoger
290
Praktisch
340
Middelbaar
700
Europa
60
Nederland
1.750
Buiten Europa
75
Label C
268
Label B
168
Label A
143
Label G
95
Label D
72
Label F
61
Label E
50
Label A++++
18
Label A+++
5
Label A+
4
Label A++
1
Label A+++++
0
| Year | Gas (m3) | Electricity (kWh) |
|---|---|---|
| 2020 | 1.400 | 2.780 |
| 2021 | 1.610 | 2.810 |
| 2022 | 1.250 | 2.730 |
| 2023 | 1.040 | 2.650 |
| 2024 | 1.010 | 2.730 |
Hoekwoning
Gas: 940 • Electricity: 2.160
Huurwoning
Gas: 880 • Electricity: 1.920
Koopwoning
Gas: 1.150 • Electricity: 3.140
Appartement
Gas: 770 • Electricity: 2.070
Tussenwoning
Gas: 860 • Electricity: 1.970
Vrijstaande woning
Gas: 1.330 • Electricity: 3.600
Twee-onder-één-kap woning
Gas: 1.020 • Electricity: 2.620
Total number of company establishments: 210
| Period | Crimes |
|---|---|
| jan 2025 | 2 |
| jan 2026 | 2 |
| jul 2025 | 1 |
| jun 2025 | 4 |
| mei 2025 | 4 |
| mrt 2025 | 1 |
| nov 2024 | 3 |
| nov 2025 | 3 |
| okt 2024 | 4 |
| okt 2025 | 2 |
| sep 2024 | 3 |
| sep 2025 | 3 |
These figures give an indicative picture of safety trends in the living environment of Steenwijkerwold.
Short answers based on current local statistics, handy for a quick comparison of the living environment.
Steenwijkerwold telt in 2025 ongeveer 1.885 inwoners.
De gemiddelde WOZ-waarde in Steenwijkerwold is in 2025 circa € 318.000.
Het gemiddelde inkomen per inwoner in Steenwijkerwold ligt rond € 28.600 per jaar.
Voor het huidige jaar gaat het om ongeveer 29 geregistreerde misdrijven. Gebruik deze cijfers als indicatie en vergelijk trends per periode.
In Steenwijkerwold komt vooral "Vrijstaande woningen" veel voor, met ongeveer 288 woningen.