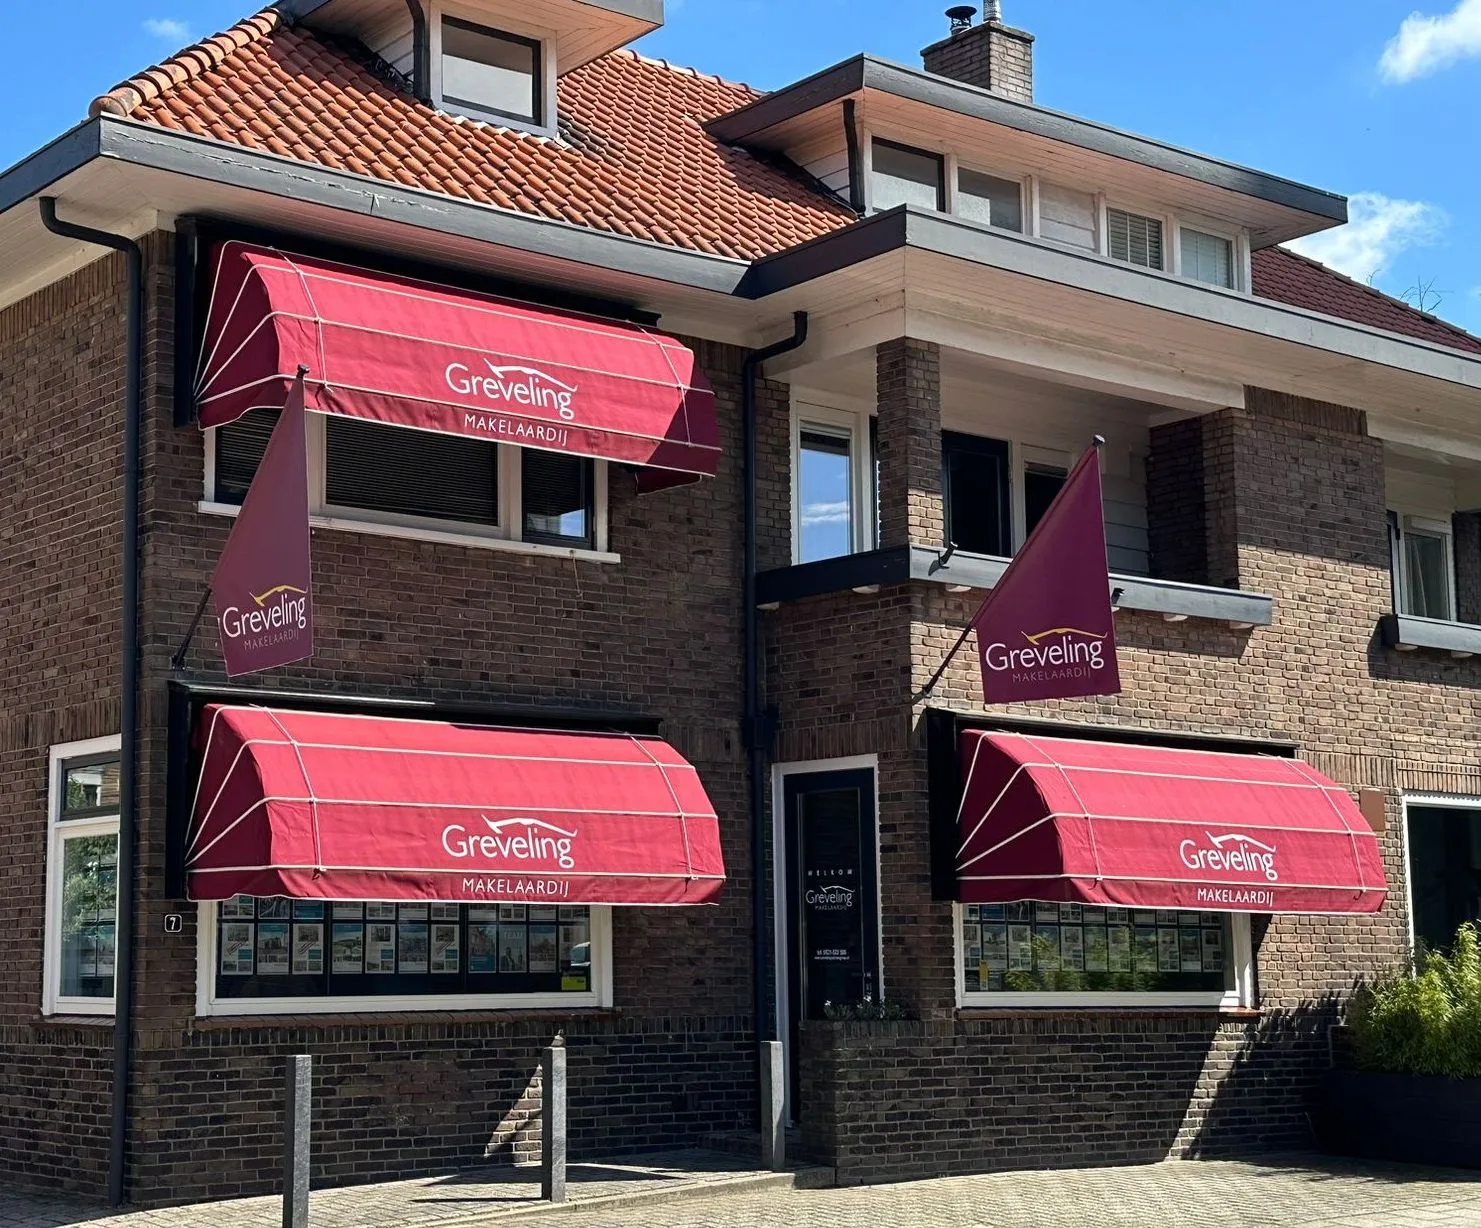
HetMakelaarshuis

The Makelaarshuis stands for reliable and personal guidance when buying or selling a home. We listen to your wishes and help you advise accordingly. From the first conversation, we explain what needs to be provided in order to achieve your goal. With a clear plan of action and transparent communication, we ensure that you feel at ease during this important decision. When selling, we support you with a detailed valuation, drafting persua...
Current housing stock
-
- Available
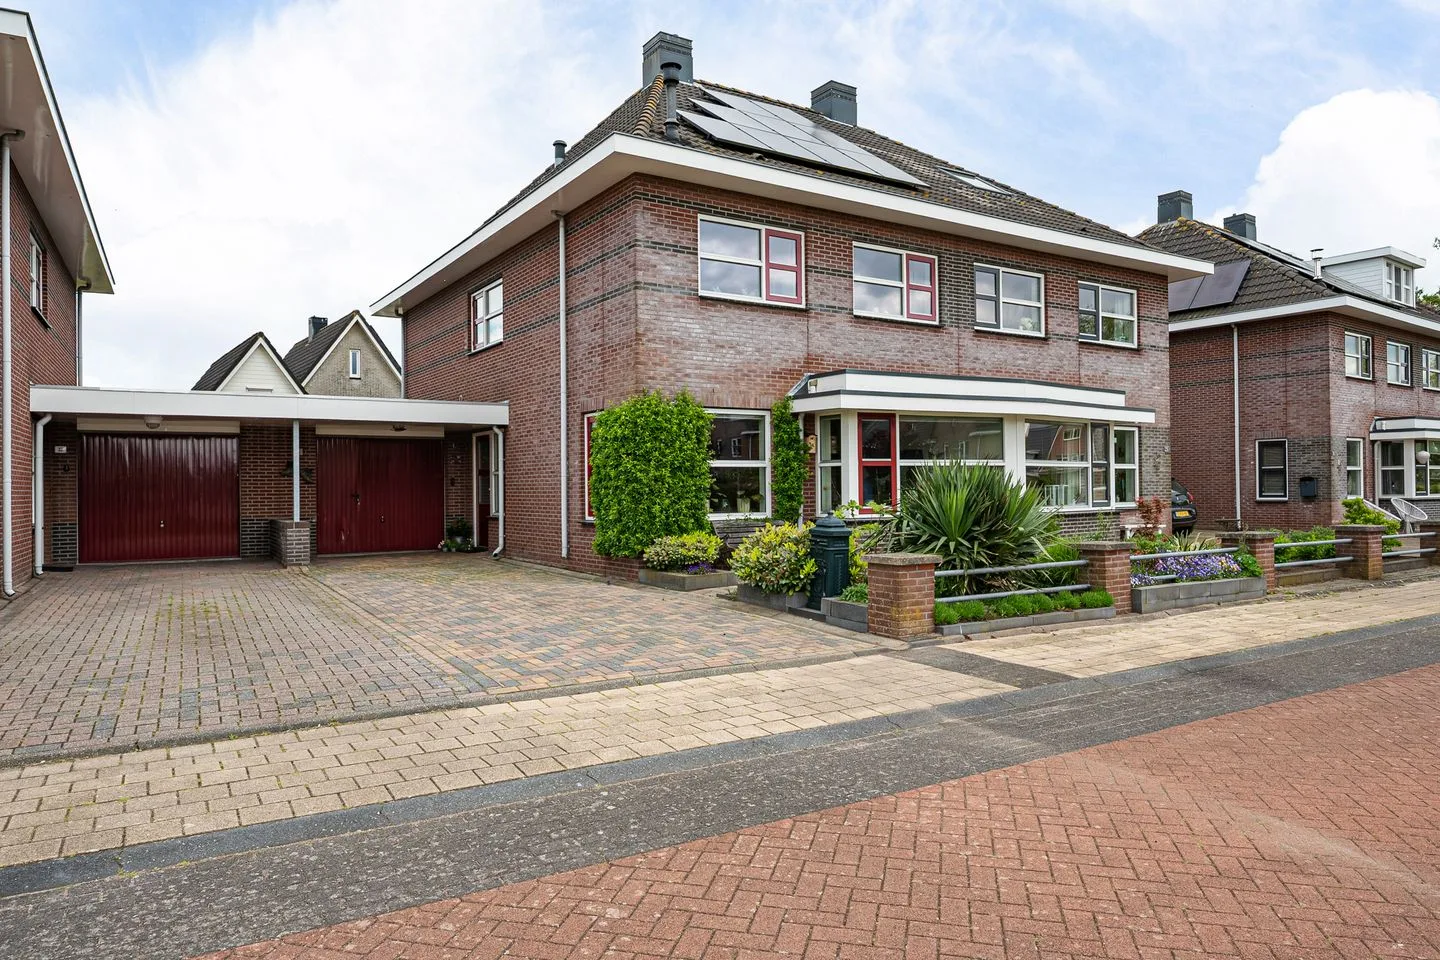
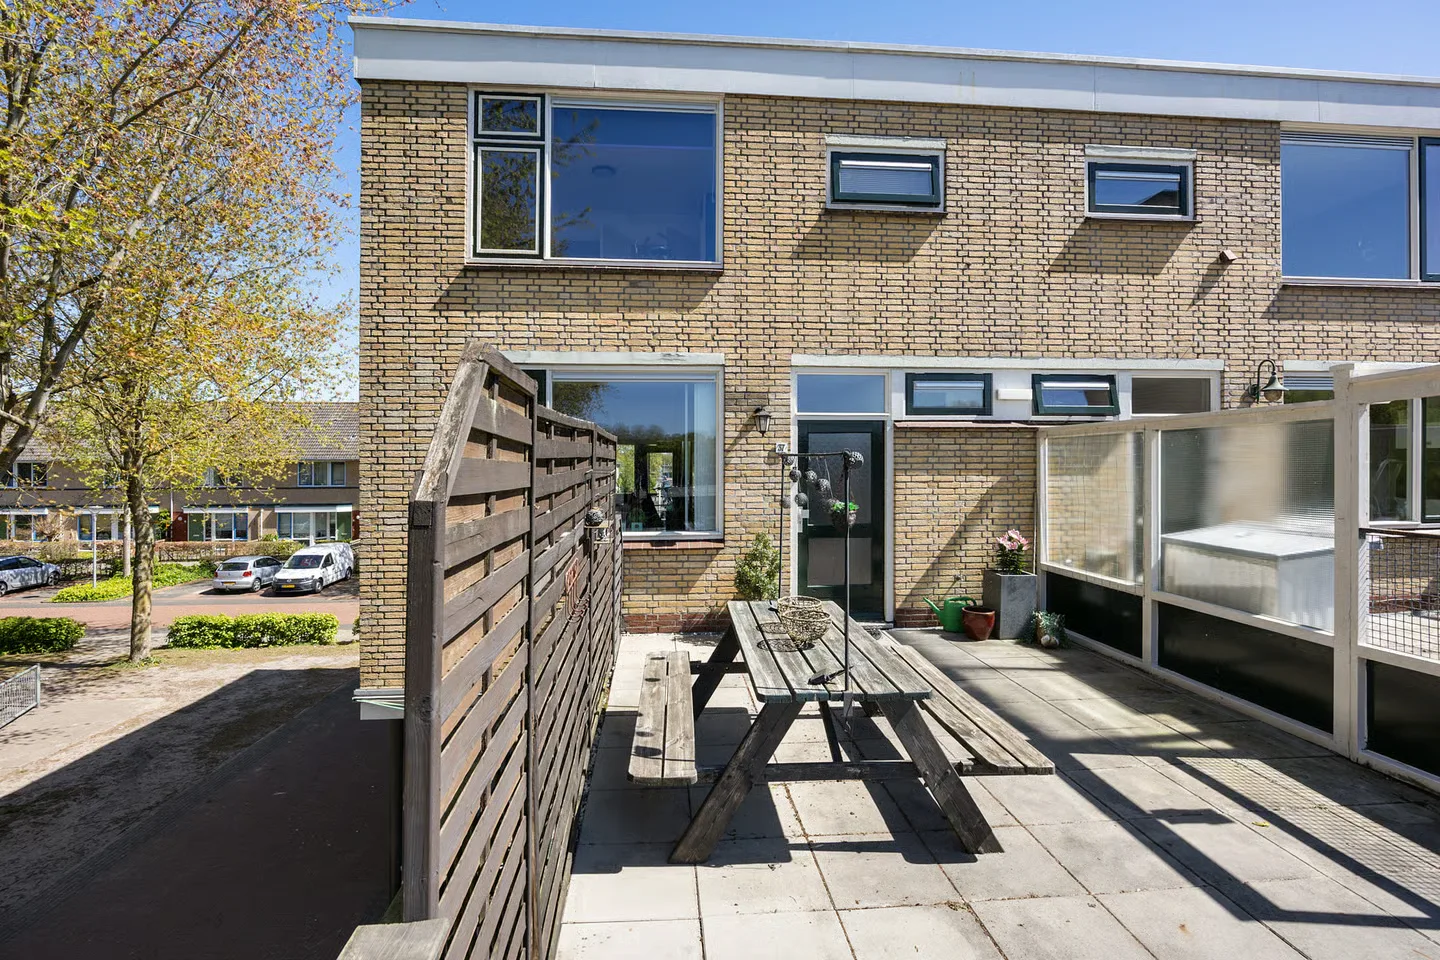
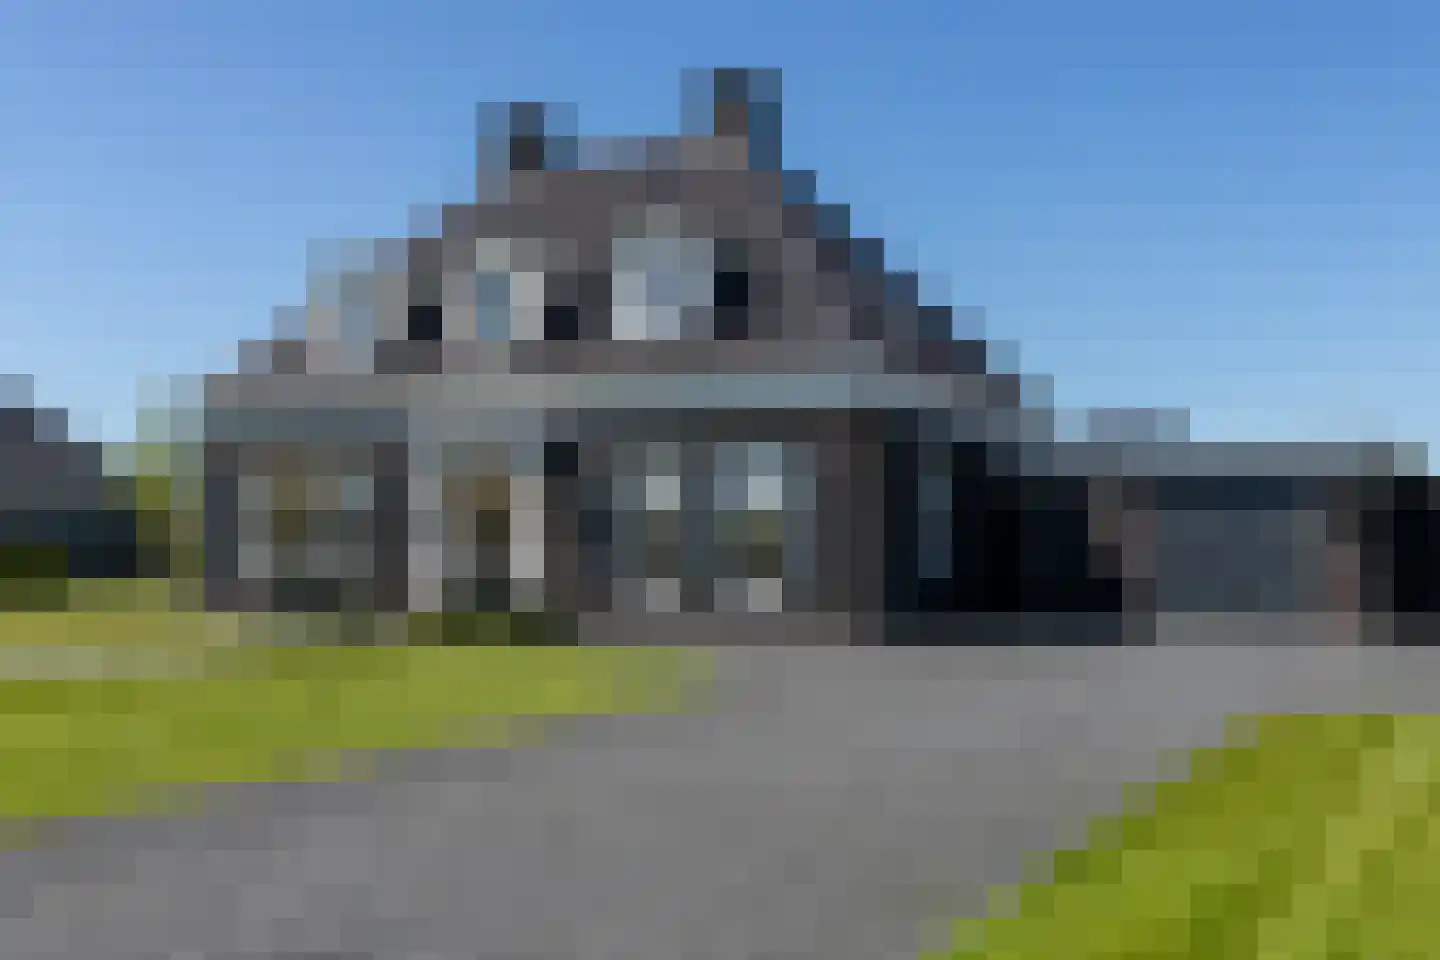
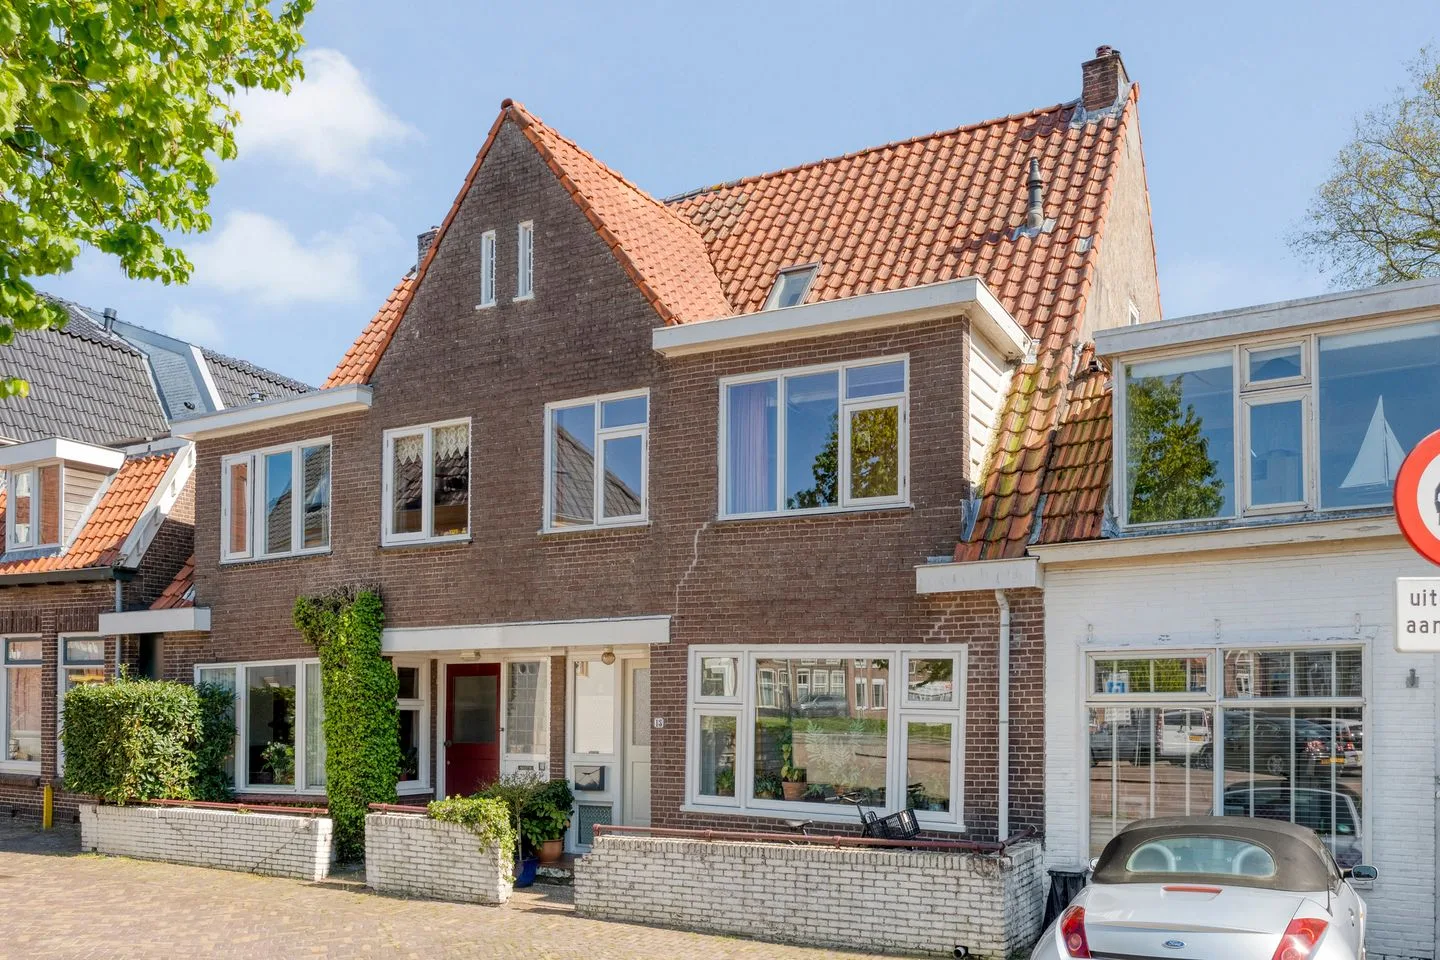
Steenwijkerdiep 13
8331LN Steenwijk
€ 305.000 k.k.
€ 2.133/m²
CSave as favorite- Living area
- 143 m²
- Land area
- 163 m²
- Bedrooms
- 4
-
- Available
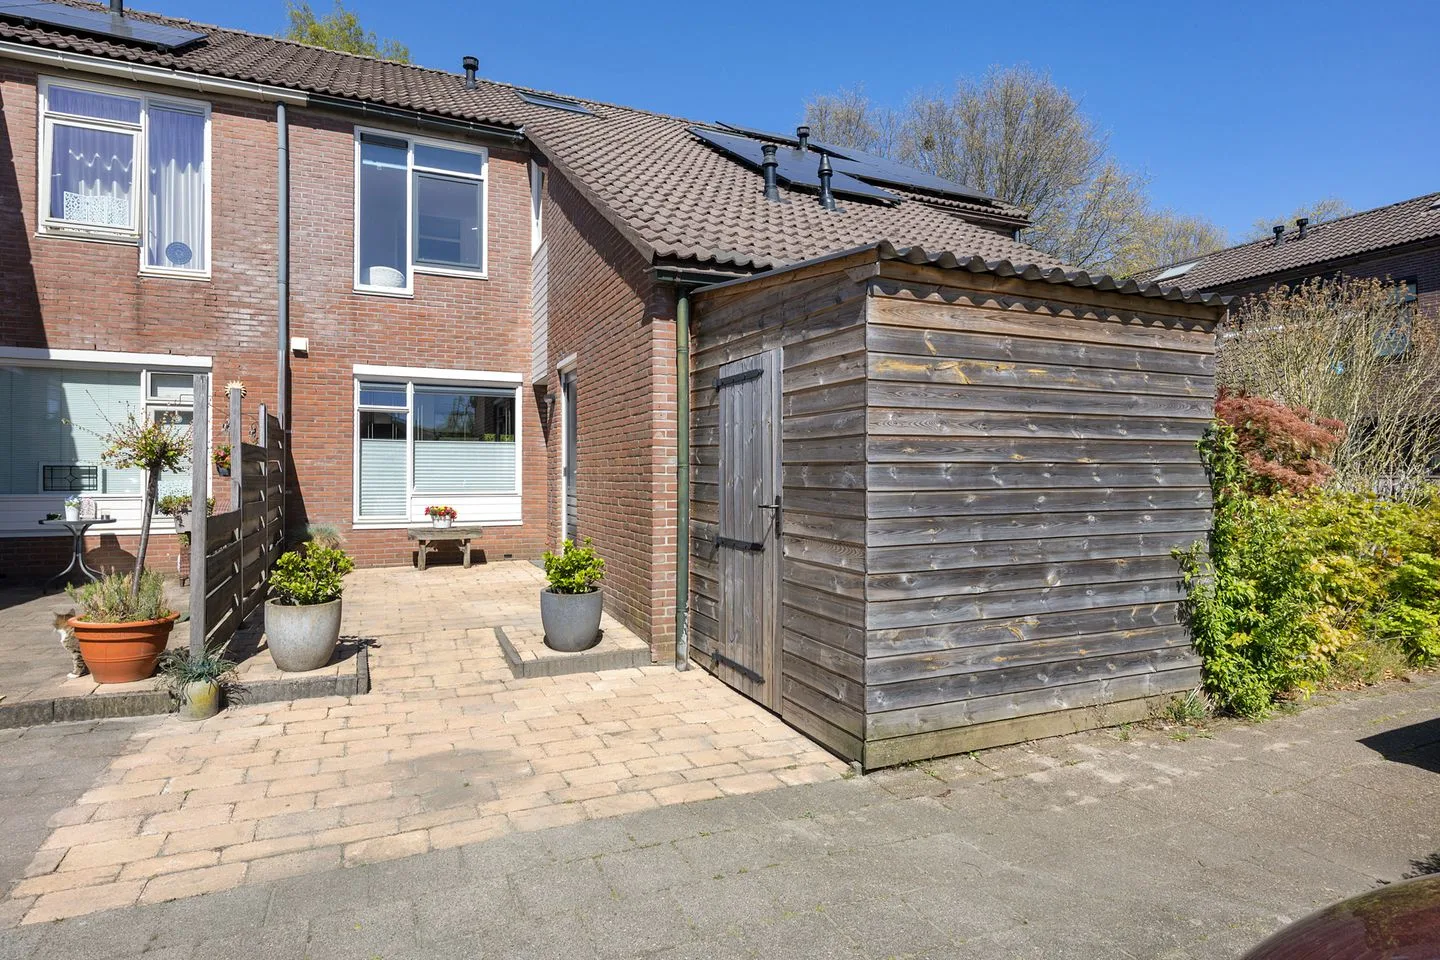
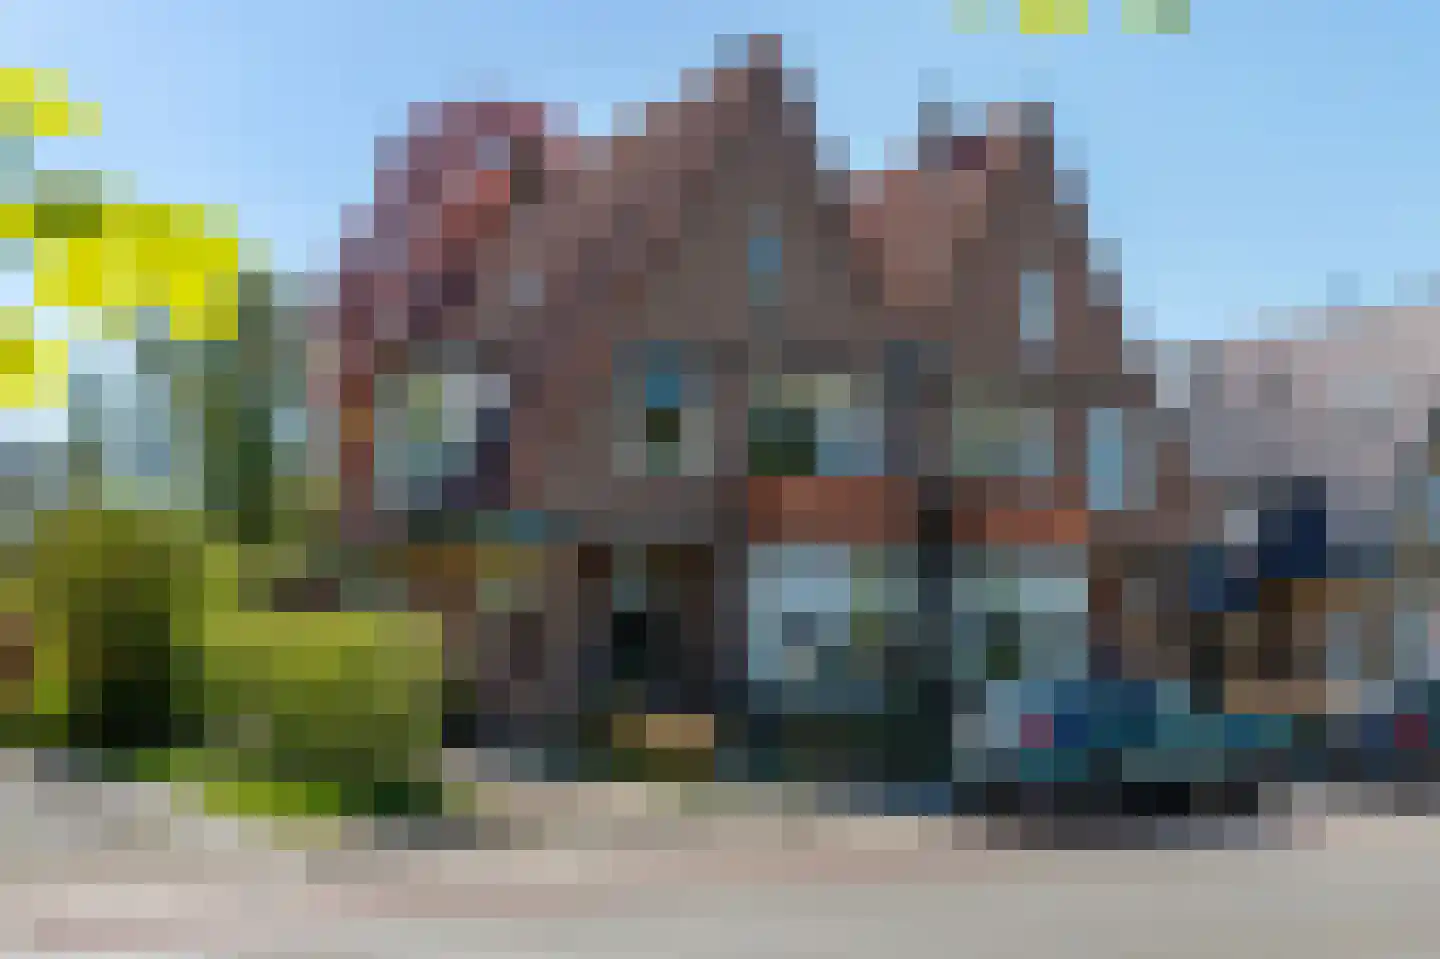
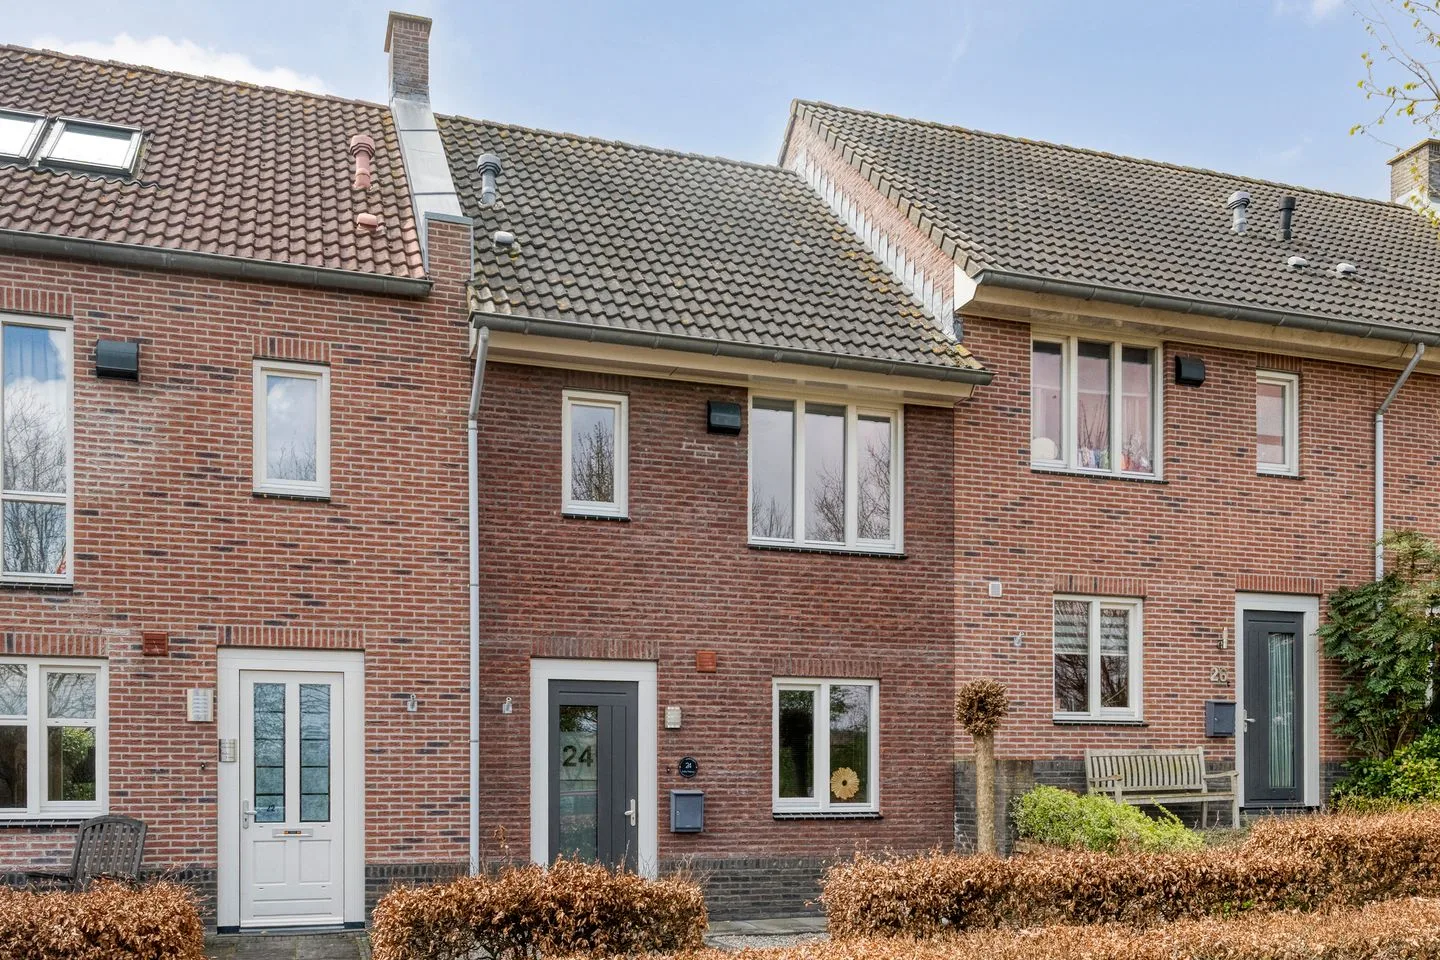
De Heerlijkheid 24
8334SZ Tuk
€ 359.000 k.k.
€ 3.324/m²
ASave as favorite- Living area
- 108 m²
- Land area
- 146 m²
- Bedrooms
- 3
-
- Available
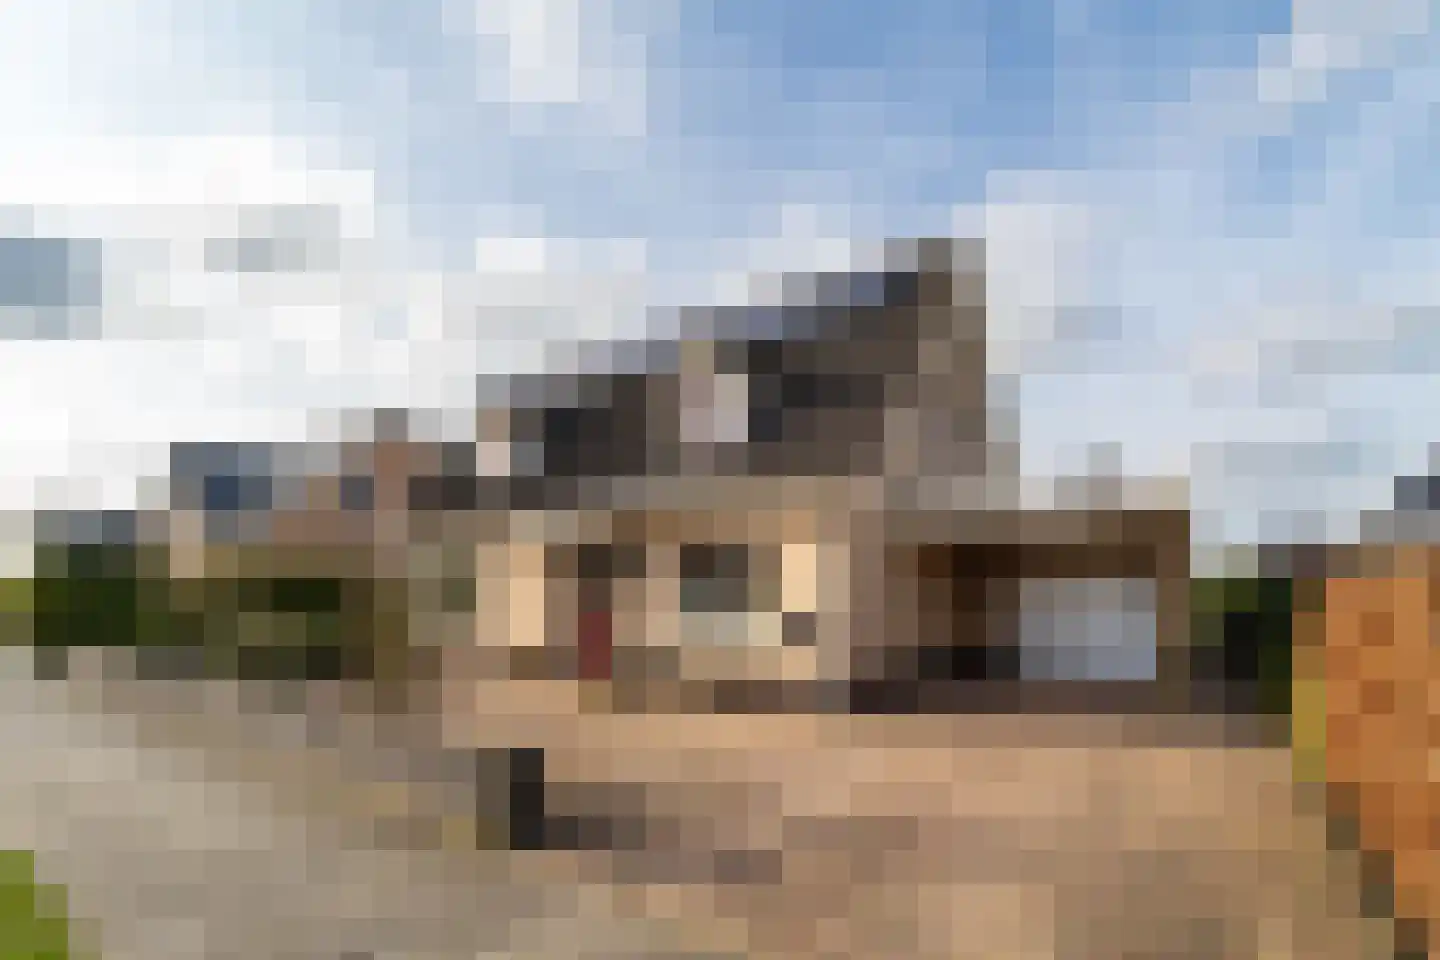
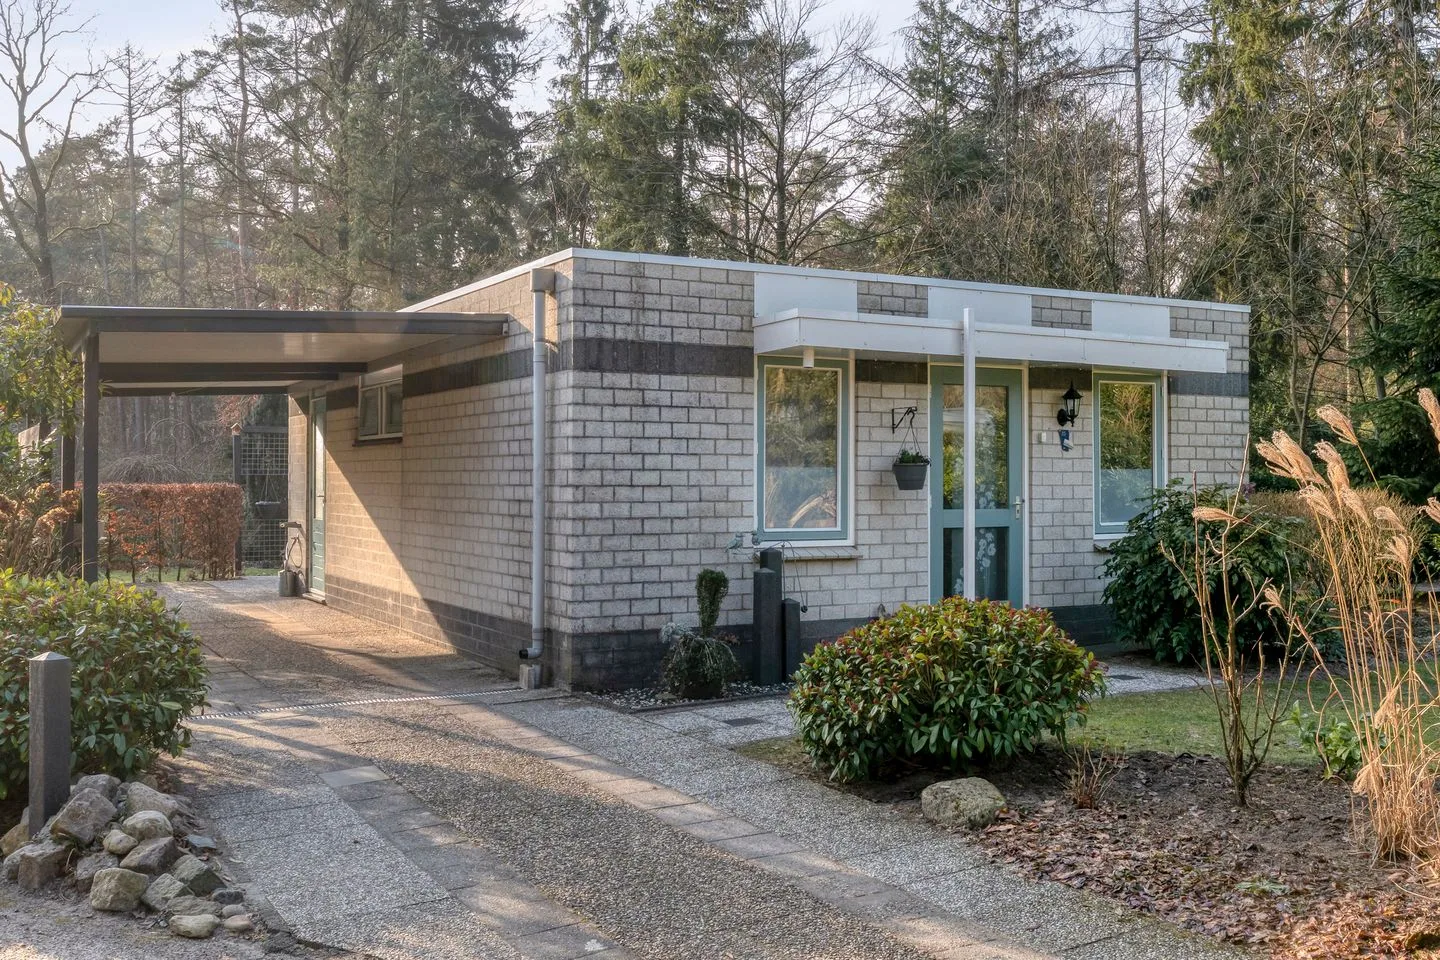
Duivenslaagte 2 023
8346KH De Bult
€ 210.000 k.k.
€ 3.818/m²
CSave as favorite- Living area
- 55 m²
- Land area
- 540 m²
- Bedrooms
- 3
-
- Available
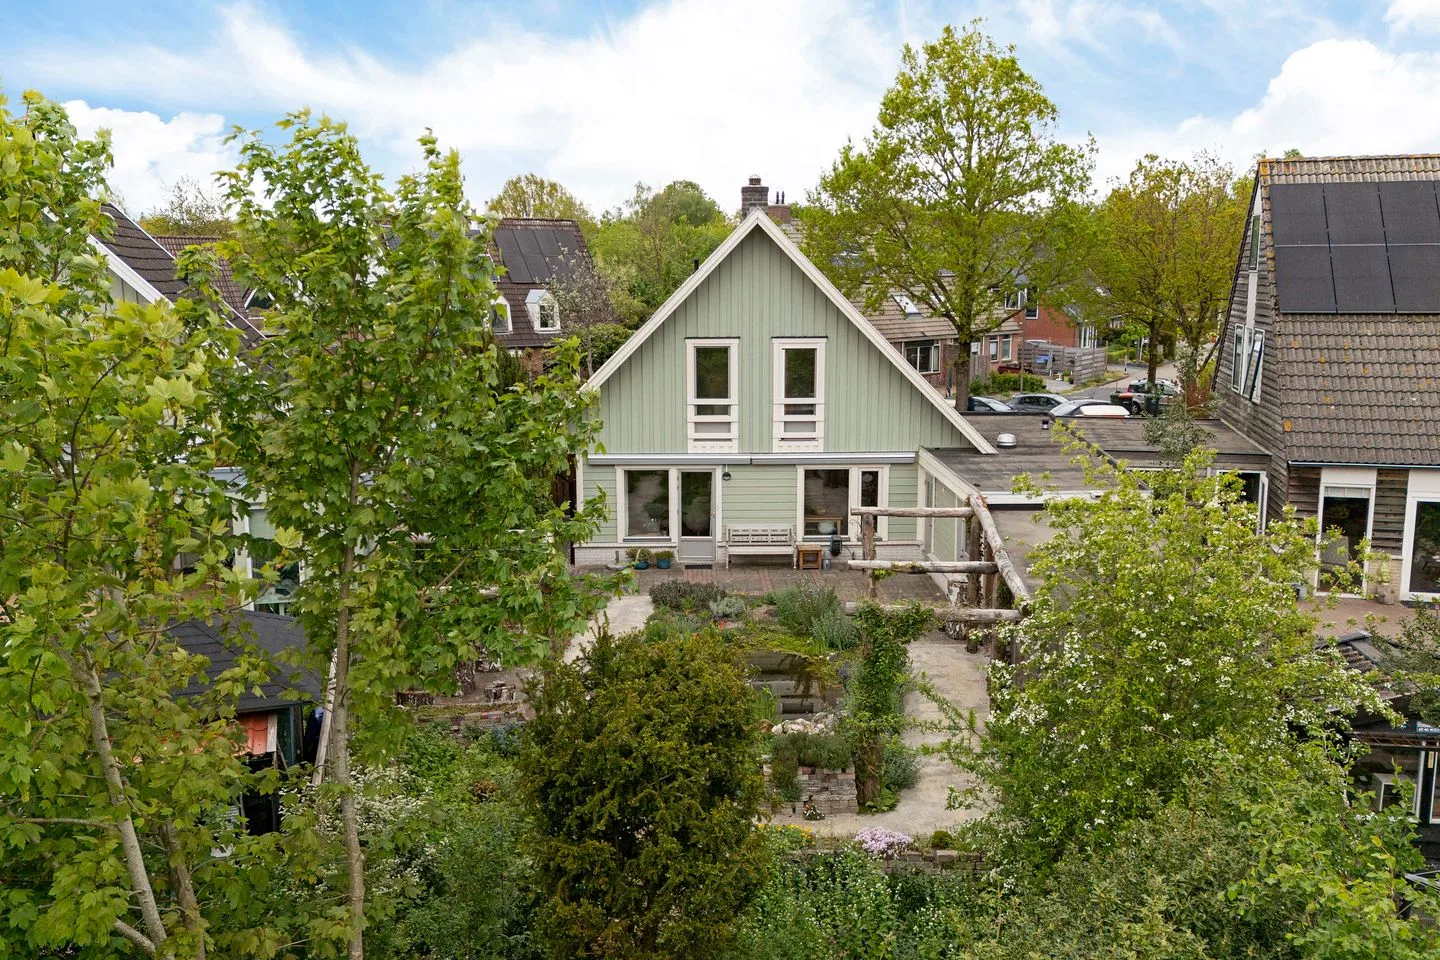
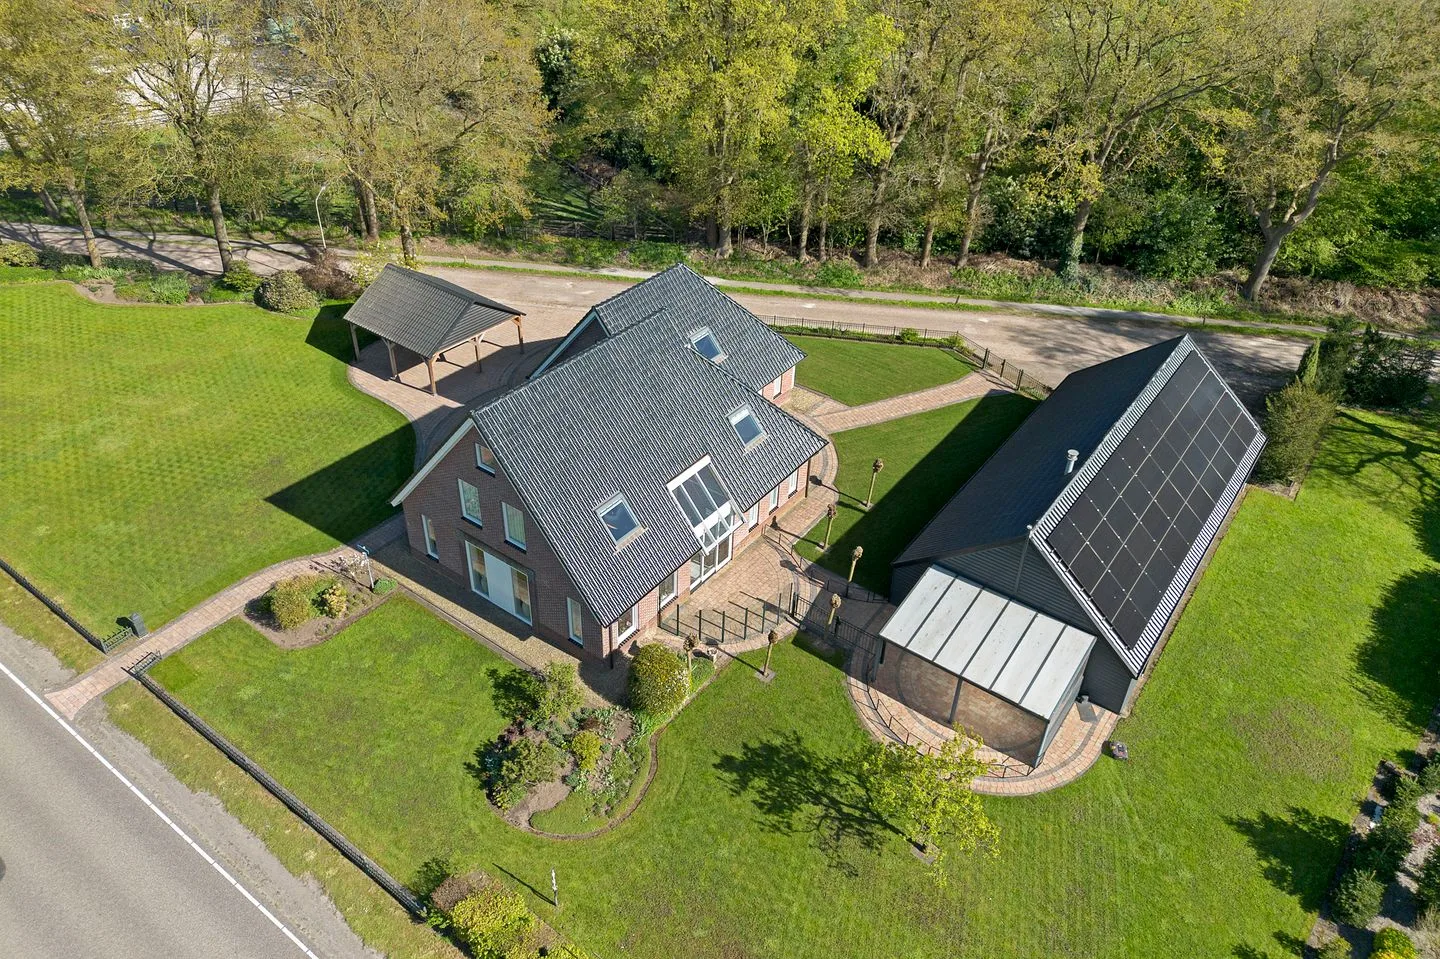
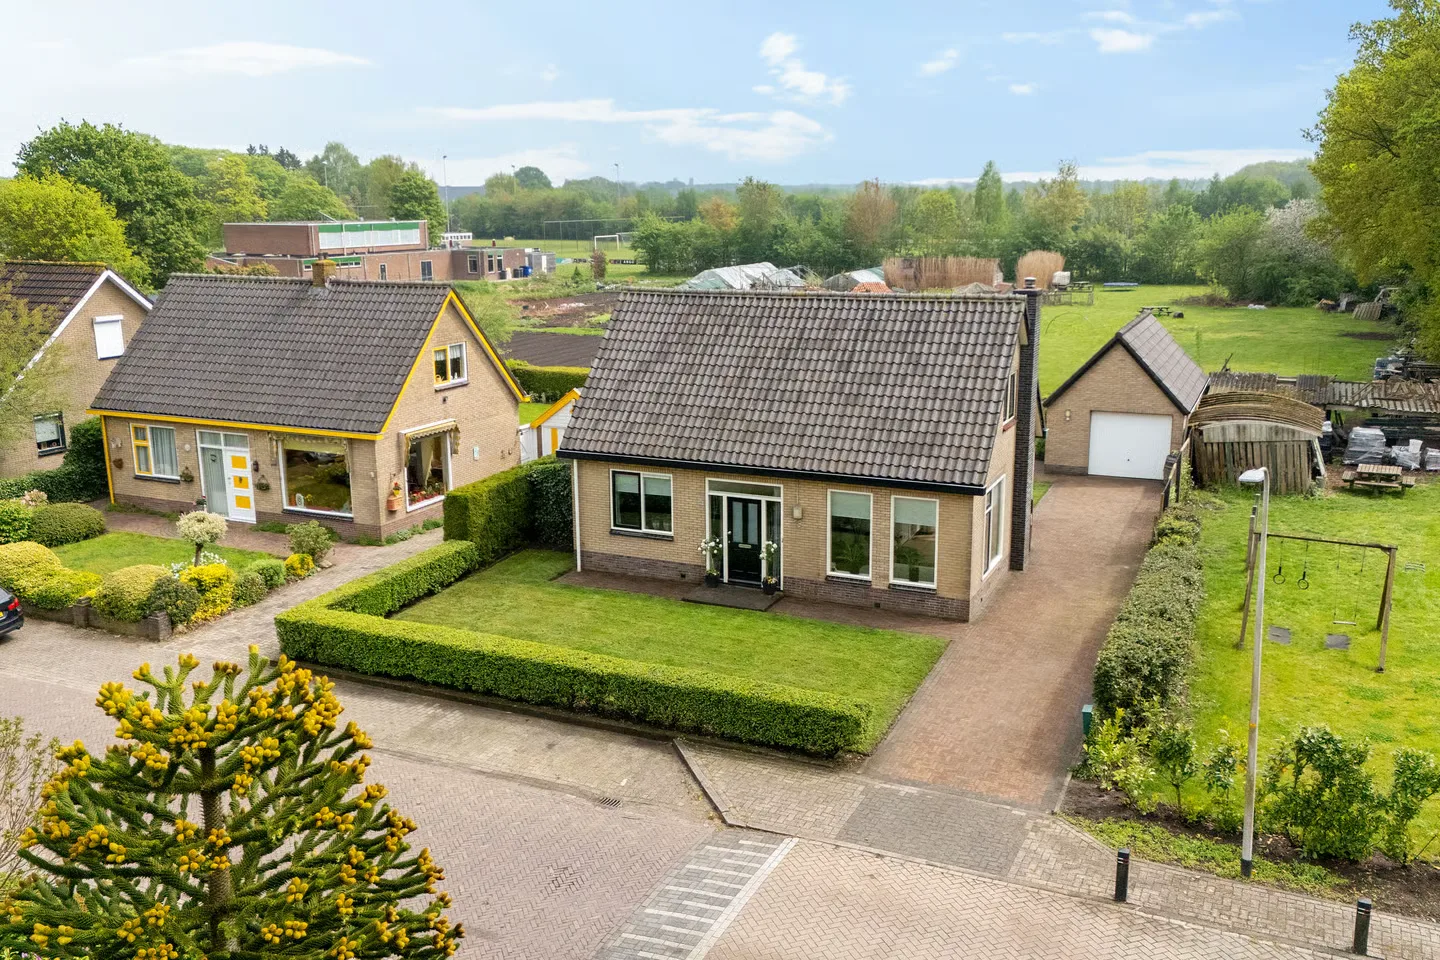
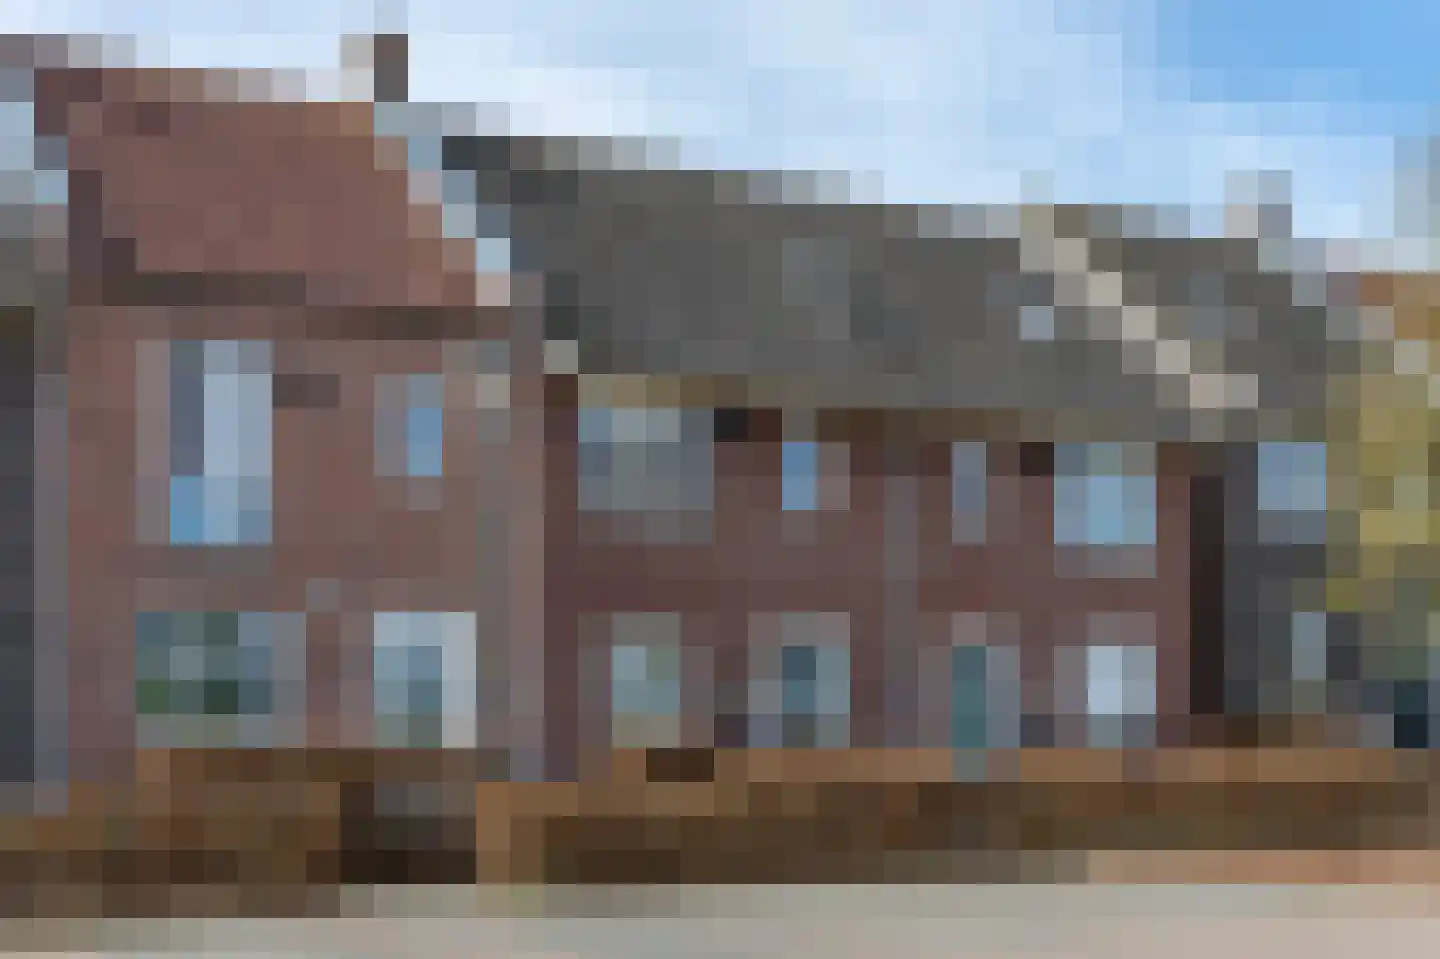
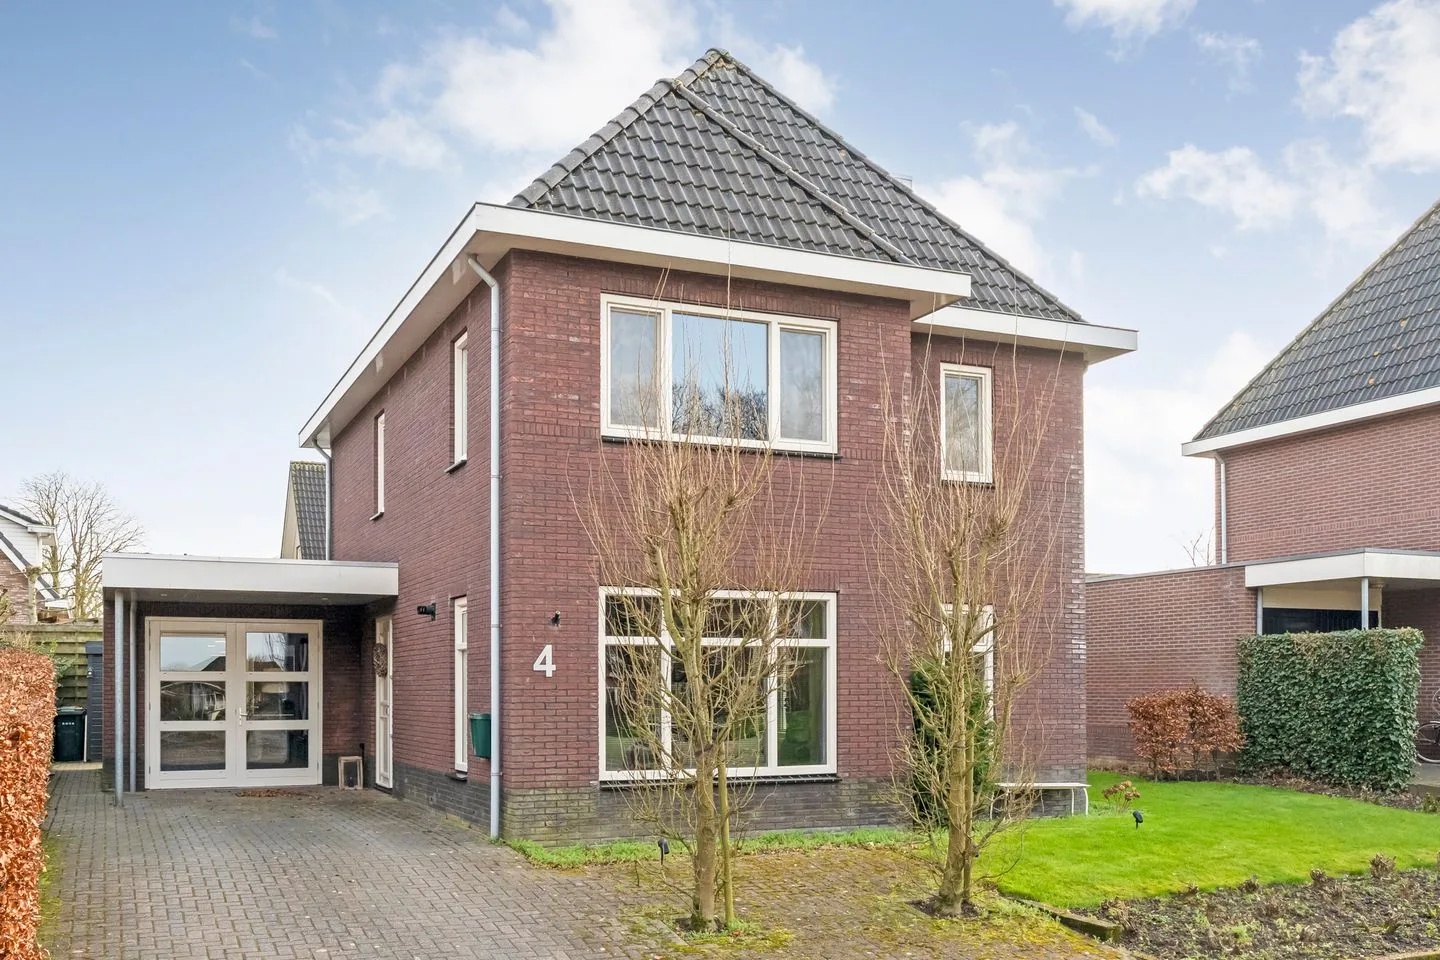
St. Andreasstraat 4
8341NC Steenwijkerwold
€ 675.000 k.k.
€ 3.409/m²
A++Save as favorite- Living area
- 198 m²
- Land area
- 426 m²
- Bedrooms
- 4
-
- Available
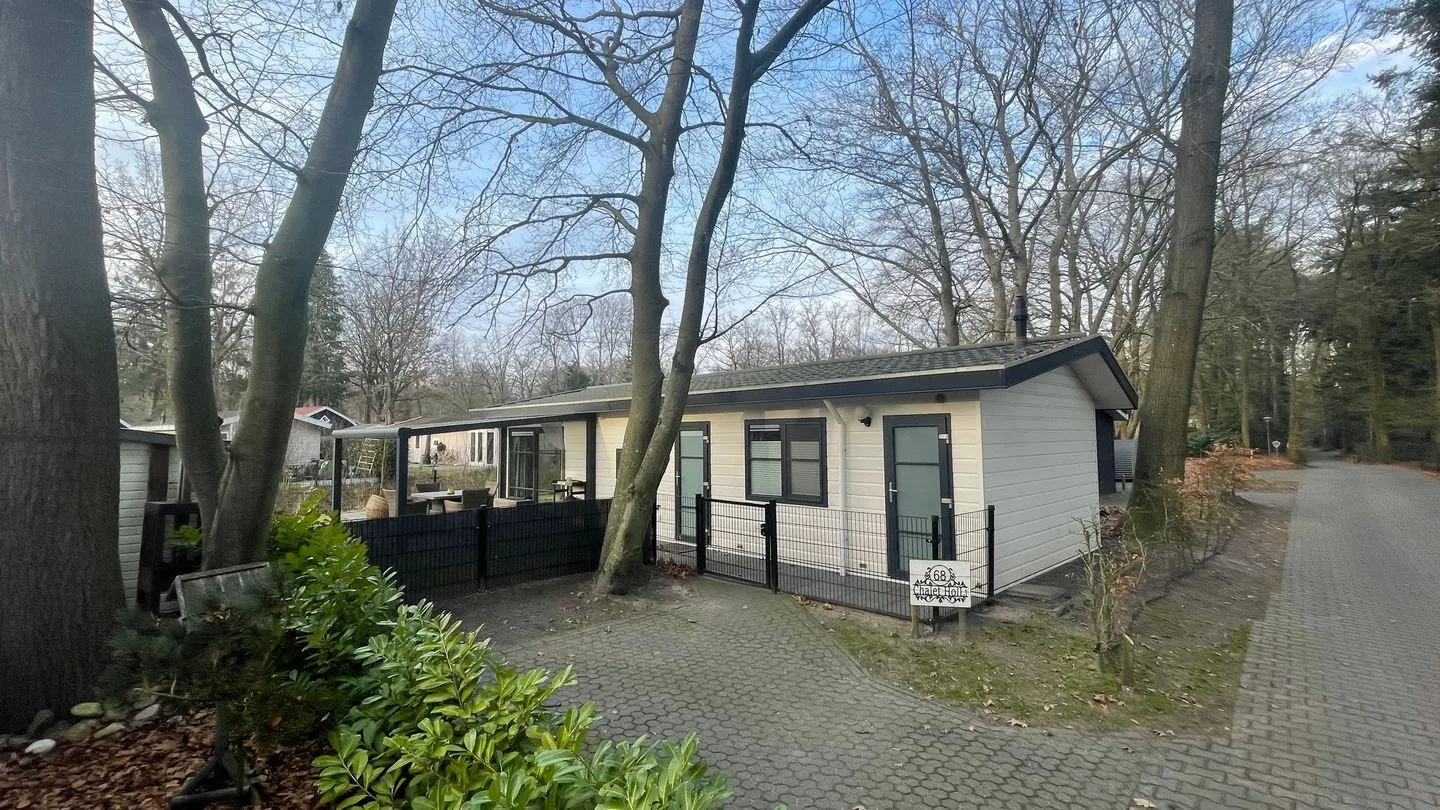
Bultweg 25 R 68
8346KB De Bult
€ 100.000 k.k.
€ 2.272/m²
Save as favorite- Living area
- 44 m²
- Land area
- 200 m²
- Bedrooms
- 2
-
- Available
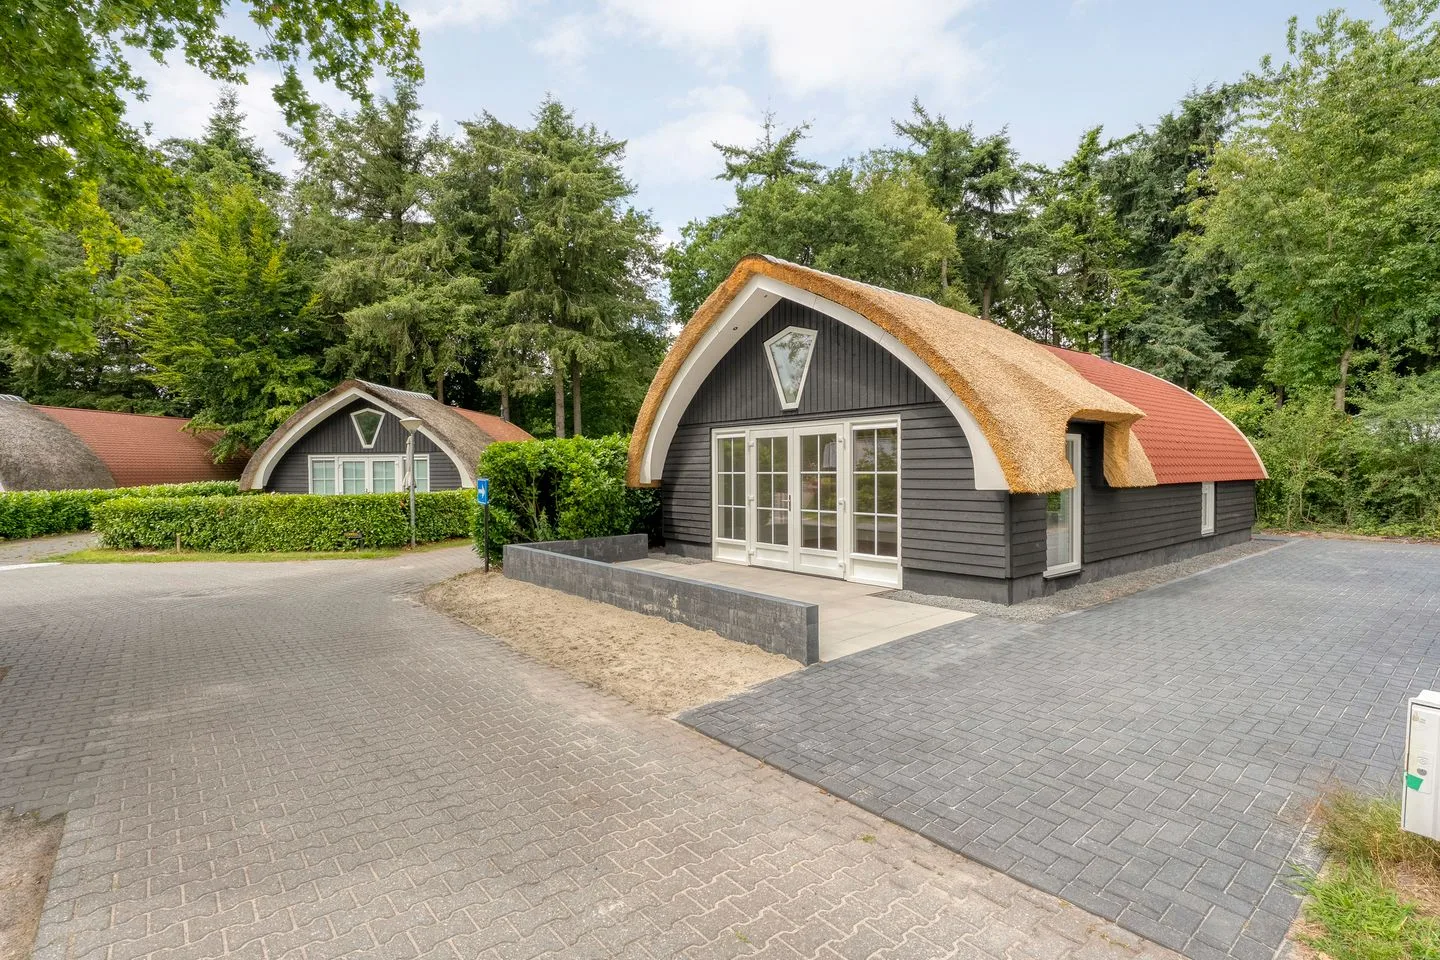
Bultweg 25 R 40
8346KB De Bult
€ 189.500 k.k.
€ 3.793/m²
ASave as favorite- Living area
- 58 m²
- Land area
- 240 m²
- Bedrooms
- 2
Reviews (41)
Review platforms
BronscoresTotal score
41 total reviews

Funda
29 reviews on Funda

12 reviews on Google
-
Waardeel 78
10Bij kennismaking direct een goed gevoel; open, eerlijk en vertrouwen. We zijn heel prettig en deskundig door het hele verkoopproces geleid. Ons 1e gevoel was helemaal terecht
-
Stationsplein 12
8Translated by AIwell accessible, lines are short. with both real estate agents, Nick and Edwin, we had good contact. they handled it professionally.
-
Dorpsstraat 55
10We hebben al eerder een huis verkocht en gekocht met deze makelaar. Fijne begeleiding door Edwin en Nick. Ze staan altijd klaar met advies en tips. Erg tevreden!
-
Bergweg 76 R442
10Translated by AIThe contact was pleasant, professional and honest. A personal approach where they take the time to give advice and remain calm in complex situations. I can wholeheartedly recommend them.
-
Piet Heinstraat 6
10Translated by AICompetent, fast and efficient help. The house was quickly sold through the agent's large network. Clear and transparent communication with a fair price.
-
Preistingestraat 35
10Translated by AIThe Makelaarshuis takes into account the wishes of the customer and also looks at the people themselves. A personal contact is very nice when buying a house and that is what Het Makelaarshuis ensures. For that, I want to thank them.
-
Onnastraat 16
10Translated by AIWe were very satisfied from beginning to end, excellent guidance was provided and we were kept well informed of the progress, and were very pleased with the outcome of the sale.
-
Sangerland 48
9Translated by AIGood and especially easy contact with Nick, Edwin, and Jan; they are always there for nearly every question or comment. Regards, Koos
-
Oostercluft 46
10Translated by AIBoth brokers from Makelaarshuis Steenwijk were expert, very friendly and accessible. Mr. Willemsen was both the purchasing broker for the new home and the selling broker of the property at Oosterlcluft in Steenwijk. The financial employee who works with Makelaarshuis also helped me very well.
-
Verlaatseweg 41
9Translated by AIThanks to Edwin and Nick, we got a realistic picture of the current housing market. The service was truly top-notch; every question we had was explained thoroughly. They thought along with us and helped us make the right choices.
-
Bakkersveld 29
10Translated by AIThe contacts with Edwin, Nick and Jan were very pleasant. We could always turn to them if we needed a little help somewhere or were looking for clarity about something. The guidance was very professional and expert. We felt in trusted hands and would definitely use Het Makelaarshuis again next time (although: never move again! ;-) ). Edwin, Nick and Jan: thanks again!
-
Meester Hofstraat 23
9Translated by AIWe received direct, fine and pleasant contact and honest advice for the sale of our home.
-
Bergweg 41
10Translated by AIThe guidance was excellent throughout the entire process. From help as a buyer's agent with my new house. As well as when selling my old house.
-
Oostercluft 8
10Translated by AIThe contact was valuable. Appointment information for the apartment and valuation of own home Within 24 hours an appointment for viewing and within 48 hours the action was successful. Further settlement via Financial Diestverlening Financieel Fit was quickly arranged.
-
H.van Steenwijck de oude straat 7
10Translated by AIGood contact, short lines and good guidance and consultation. For all your questions, you can go directly to us.
-
Stationsplein 28
10Translated by AIIt wasn't the first time and certainly not the last time that we sold our home through Het Makelaarshuis.
-
Koningsland 30
9Translated by AIThe contact was very pleasant. Honest, tidy and thinks along with you. All made appointments were perfectly kept. And everything is easy to follow with a handy online system.
-
Het eenspan 24
10Translated by AIExpert, helpful, friendly and easily accessible. The real estate agent will excellently guide you through the sale of your house and assist you with valuable advice.
-
Bakkersveld 2
10Translated by AIExtremely satisfied with Edwin Willemsen from Makelaarshuis in Steenwijk. This is now the third time in the past 21 years that we have asked him to sell our house. Edwin is extremely skilled in his profession, is realistic, straightforward and doesn't sell empty promises. He has enormously good and original ideas about how the house should be brought to market. He maintains an overview, remains calm but alert. In short, complete hassle-free service!
-
Rembrandtstraat 37
10Translated by AIContact lapsed smoothly and easily. Edwin clearly says what comes to mind. In less easy times, they take complete care of you. And in our case, they completely took matters out of our hands. And we were only approached at moments of important events.