
Residents
70.799
Last year: 2026
3904PA Veenendaal • Utrecht
For this property, no detailed description is available yet.
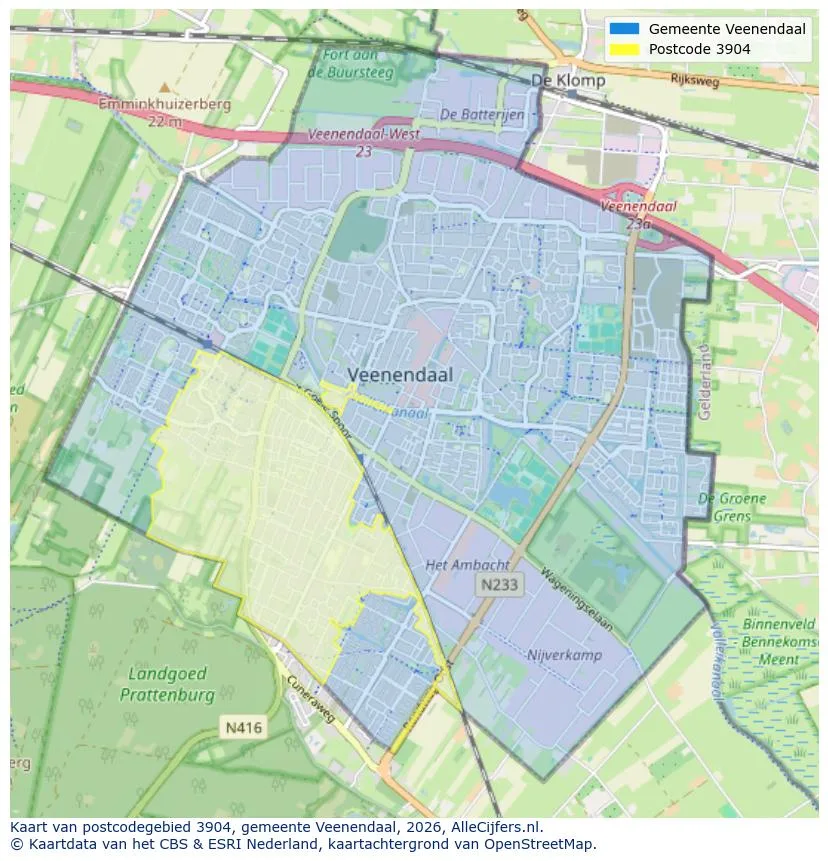
Geographic orientation and real estate agent density in Veenendaal
View current location data on residents, WOZ development, housing stock, energy consumption, business activity and safety in Veenendaal. In 2026 were there 70.799 residents. The average WOZ value in 2025 is EUR 394.000.
Residents
70.799
Last year: 2026
Average WOZ
EUR 394.000
Last year: 2025
Average income per person.
EUR 32.400
Source: AllNumbers
Crimes (current year)
2.223
Total registered
| Year | Residents |
|---|---|
| 2022 | 67.671 |
| 2023 | 68.525 |
| 2024 | 69.440 |
| 2025 | 70.352 |
| 2026 | 70.799 |
| Year | Average WOZ |
|---|---|
| 2021 | EUR 275.000 |
| 2022 | EUR 303.000 |
| 2023 | EUR 374.000 |
| 2024 | EUR 388.000 |
| 2025 | EUR 394.000 |
Hoger
28
Praktisch
27
Middelbaar
44
Europa
3.700
Nederland
54.861
Buiten Europa
11.791
Label A
8.354
Label C
8.320
Label B
5.401
Label D
2.259
Label E
1.833
Label G
1.497
Label F
1.367
Label A+
999
Label A+++
962
Label A++
716
Label A++++
77
Label A+++++
15
| Year | Gas (m3) | Electricity (kWh) |
|---|---|---|
| 2020 | 1.000 | 2.810 |
| 2021 | 1.130 | 2.860 |
| 2022 | 880 | 2.670 |
| 2023 | 740 | 2.510 |
| 2024 | 720 | 2.560 |
Hoekwoning
Gas: 860 • Electricity: 2.770
Huurwoning
Gas: 620 • Electricity: 2.010
Koopwoning
Gas: 830 • Electricity: 2.840
Appartement
Gas: 570 • Electricity: 1.970
Tussenwoning
Gas: 740 • Electricity: 2.550
Vrijstaande woning
Gas: 1.320 • Electricity: 4.310
Twee-onder-één-kap woning
Gas: 980 • Electricity: 3.160
Total number of company establishments: 9.020
| Period | Crimes |
|---|---|
| jan 2026 | 211 |
| jul 2025 | 197 |
| jun 2025 | 175 |
| mei 2025 | 206 |
| mrt 2025 | 214 |
| mrt 2026 | 211 |
| nov 2024 | 191 |
| nov 2025 | 173 |
| okt 2024 | 191 |
| okt 2025 | 192 |
| sep 2024 | 175 |
| sep 2025 | 182 |
These figures give an indicative picture of safety trends in the living environment of Veenendaal.
Short answers based on current local statistics, handy for a quick comparison of the living environment.
Veenendaal telt in 2026 ongeveer 70.799 inwoners.
De gemiddelde WOZ-waarde in Veenendaal is in 2025 circa € 394.000.
Het gemiddelde inkomen per inwoner in Veenendaal ligt rond € 32.400 per jaar.
Voor het huidige jaar gaat het om ongeveer 2.223 geregistreerde misdrijven. Gebruik deze cijfers als indicatie en vergelijk trends per periode.
In Veenendaal komt vooral "Appartementen" veel voor, met ongeveer 13.201 woningen.
View more homes in this location.

3901PA Veenendaal
€ 595.000 k.k.
€ 4.190/m²

3904ZA Veenendaal
€ 335.000 k.k.
€ 4.136/m²

3902KZ Veenendaal
€ 489.000 k.k.
€ 3.420/m²

3905RZ Veenendaal
€ 519.000 k.k.
€ 4.634/m²

3903GG Veenendaal
€ 550.000 k.k.
€ 5.340/m²

3902CP Veenendaal
€ 449.500 k.k.
€ 3.842/m²

3902XE Veenendaal
€ 299.500 k.k.
€ 4.341/m²

3902SC Veenendaal
€ 850.000 k.k.
€ 4.126/m²
