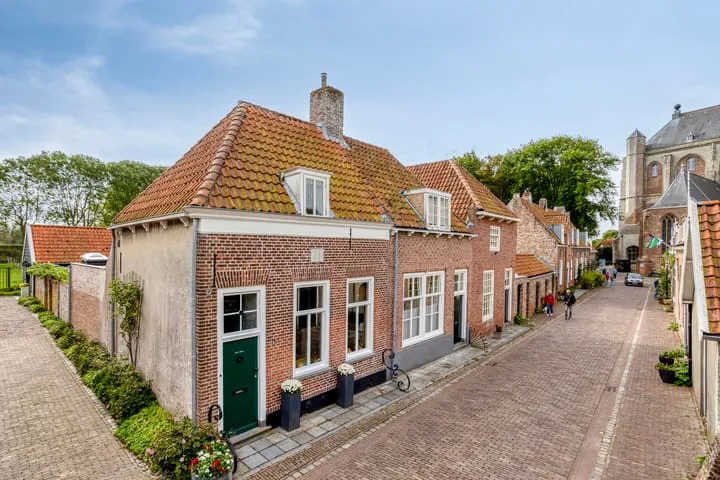
Houses sold in Veere

View 11 sold houses in Veere

Connected to: Vastgoed Nederland NVM Makelaars

On this page you will find recently sold homes in Veere. Use this overview to better estimate selling prices, popular neighborhoods, and the local housing supply before you choose a real estate agent. Also view the current housing supply with 24 houses in Veere.

Selection

Search and filter homes

Set your preferences and discover homes that suit you.

Total supply 241.953
Filters

Set price, area and other characteristics. Adjust a filter or click on Show homes. Location changes directly above.

Reset filters

You search for

  • Place Veere
  • Status Sold

Huis verkopen in Veere? Vergelijk verkoopmakelaars

Bekijk recente verkopen en ontvang gratis offertes van lokale makelaars. Vergelijk meer dan 21 makelaars in Veere.

Free request a quote

  • Quotes in Veere
  • Non-binding
  • Personal
  • Compare free rates

Zelf je woning verkopen in Veere? Vergelijk verkoopmakelaars in Veere of bekijk de beste verkoopmakelaars in Veere als referentie bij jouw keuze.

Vergelijk meerdere offertes

Makelaars maken scherpere voorstellen als ze weten dat je vergelijkt — vraag offertes aan voor verkoop of aankoop.

Frequently asked questions about sold homes in Veere

Short answers about housing prices, sold homes and comparing real estate agents in Veere.

Residential and neighborhood statistics in Veere

View current location data on residents, WOZ development, housing stock, energy consumption, business activity and safety in Veere. In 2025 were there 1.635 residents. The average WOZ value in 2025 is EUR 438.000.

These figures help to better assess and compare the housing stock in Veere with recent sold homes. Orient yourself then on suitable top real estate agents in Veere for sales advice in this region.

Residents

1.635

Last year: 2025

Average WOZ

EUR 438.000

Last year: 2025

Average income per person.

EUR 35.900

Source: AllNumbers

Crimes (current year)

43

Total registered

Demographics and WOZ development

Inhabitants per year

Inhabitants per year in Veere
Year Residents
2021 1.630
2022 1.620
2023 1.640
2024 1.665
2025 1.635

Annual WOZ value

WOZ value per year in Veere
Year Average WOZ
2021 EUR 313.000
2022 EUR 336.000
2023 EUR 379.000
2024 EUR 425.000
2025 EUR 438.000

Composition of residents

Age build-up

65+: 575 0-15: 200 15-25: 140 25-45: 265 45-65: 455

Education level

Hoger

370

Praktisch

290

Middelbaar

480

Origin of residents (2025)

Europa

150

Nederland

1.385

Buiten Europa

95

Housing stock and construction periods

Types of homes

Hoekwoningen 151
Appartementen 170
Tussenwoningen 180
Vrijstaande woningen 297
Twee-onder-één-kap woningen 89

Construction period of buildings

Voor 1700 21
1700 tot 1900 117
1900 tot 1925 105
1925 tot 1950 79
1950 tot 1970 142
1970 tot 1980 172
1980 tot 1990 80
1990 tot 2000 43
2000 tot 2010 62
2010 tot 2020 38
2020 en later 32

Energy and sustainability

Energy label distribution

Label G

184

Label C

182

Label B

152

Label F

114

Label A

113

Label D

100

Label E

36

Label A+

4

Label A++

3

Label A+++

1

Label A++++

0

Label A+++++

0

Average energy consumption per year

Average energy consumption per year in Veere
Year Gas (m3) Electricity (kWh)
2020 1.340 2.690
2021 1.570 2.920
2022 1.230 2.790
2023 1.050 2.660
2024 1.030 2.700

Consumption per house type

Hoekwoning

Gas: 980 • Electricity: 2.550

Huurwoning

Gas: 800 • Electricity: 2.110

Koopwoning

Gas: 1.130 • Electricity: 2.880

Appartement

Gas: 620 • Electricity: 1.730

Tussenwoning

Gas: 940 • Electricity: 2.120

Vrijstaande woning

Gas: 1.440 • Electricity: 3.740

Twee-onder-één-kap woning

Gas: 1.040 • Electricity: 2.650

Business activity in Veere (2025)

Handel en HORECA 70
Nijverheid en energie 30
Zakelijke dienstverlening 65
Overheid, onderwijs en zorg 45
Landbouw, bosbouw en visserij 20
Vervoer, informatie en communicatie 10
Financiele diensten en onroerendgoed 15
Cultuur, recreatie en overige diensten 20

Total number of company establishments: 280

Recent crime statistics

Recent crime statistics in Veere
Period Crimes
jan 2026 3
jul 2025 3
jun 2025 5
mei 2025 6
mrt 2025 6
mrt 2026 0
nov 2024 2
nov 2025 1
okt 2024 1
okt 2025 2
sep 2024 1
sep 2025 4

These figures give an indicative picture of safety trends in the living environment of Veere.

Frequently asked questions about living in Veere

Short answers based on current local statistics, handy for a quick comparison of the living environment.

Hoeveel inwoners heeft Veere?

Veere telt in 2025 ongeveer 1.635 inwoners.

Wat is de gemiddelde WOZ-waarde in Veere?

De gemiddelde WOZ-waarde in Veere is in 2025 circa € 438.000.

Wat is het gemiddelde inkomen per inwoner in Veere?

Het gemiddelde inkomen per inwoner in Veere ligt rond € 35.900 per jaar.

Hoe veilig is wonen in Veere?

Voor het huidige jaar gaat het om ongeveer 43 geregistreerde misdrijven. Gebruik deze cijfers als indicatie en vergelijk trends per periode.

Welke woningtypen komen het meest voor in Veere?

In Veere komt vooral "Vrijstaande woningen" veel voor, met ongeveer 297 woningen.

Receive free, non-binding quotes

Compare multiple real estate agents and choose the best match.