
Residents
34.805
Last year: 2025
5467JZ Veghel • Noord-Brabant
€ 485.000
Cost of copper (estimated): € 11.550
2% transfer tax (€ 9.700) + notary (€ 1.150) + valuation (€ 700)
Total incl. VAT: € 496.550
Purchase price /m²: € 4.369
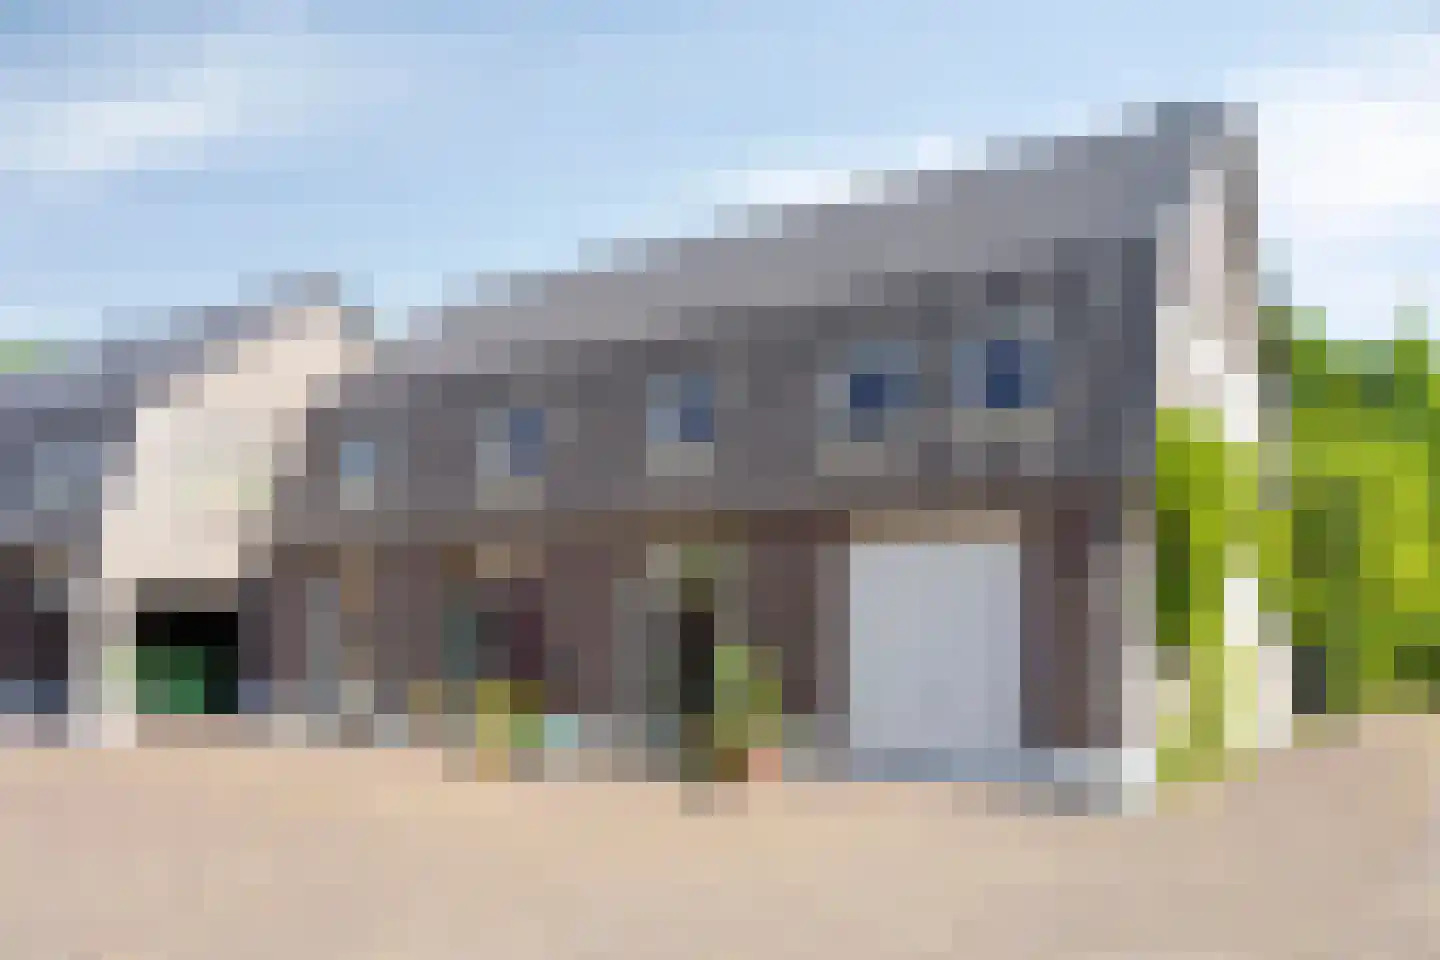
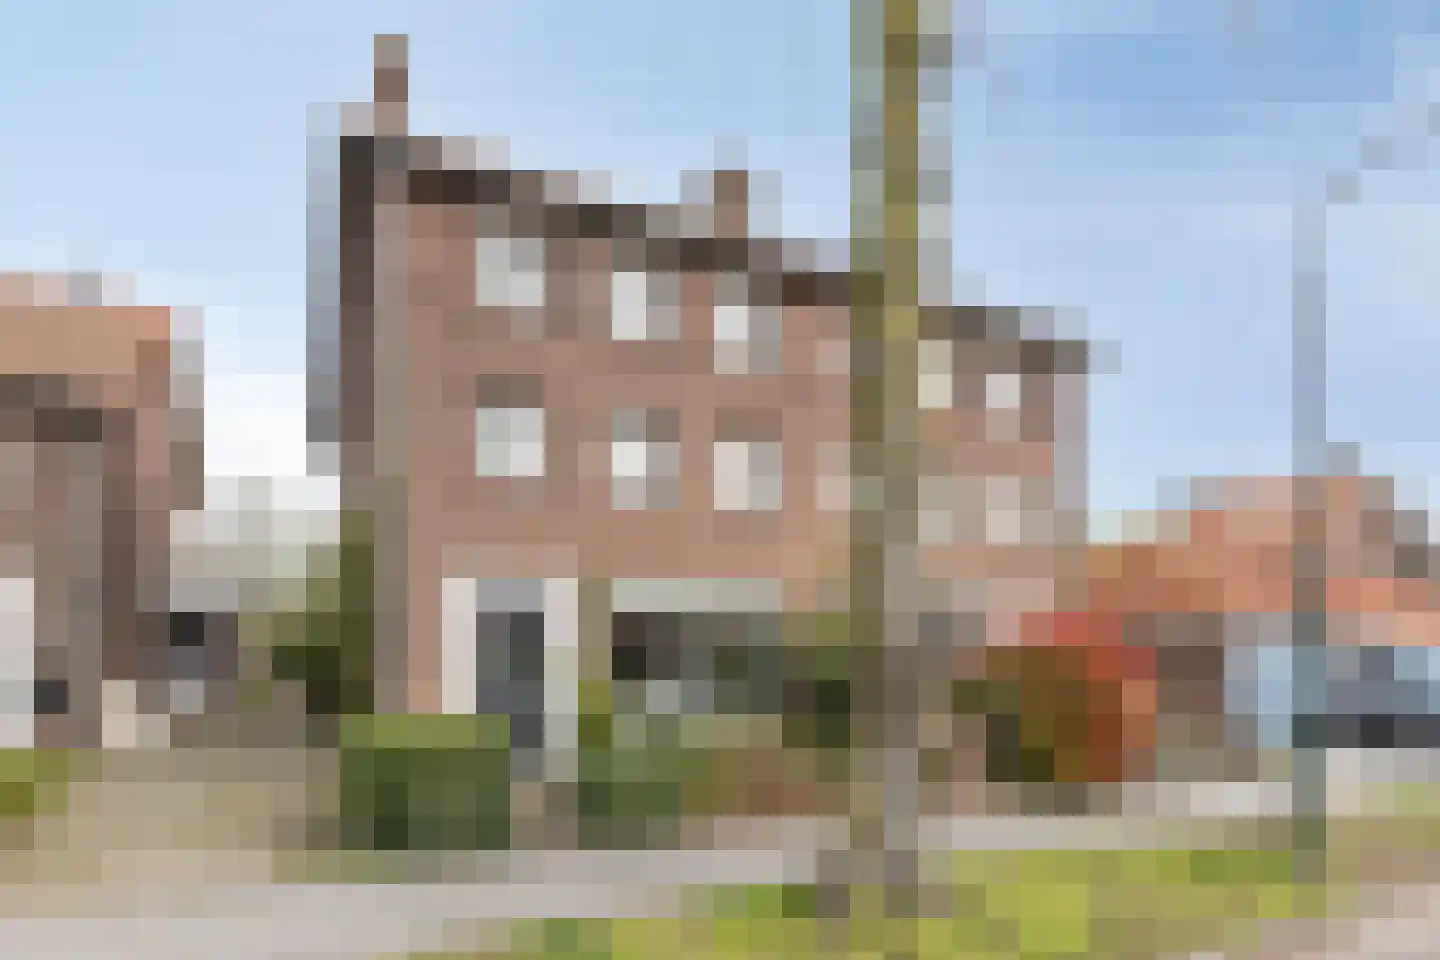
De Nieuwe Stapperij | Veghel Appartement Type A Bouwnummers: 1.5 en 2.5 Kenmerken: - Eerste en tweede verdieping - Oppervlakte 111 m² - Oppervlakte balkon 12 m² Interesse? Word je enthousiast van de gedachte aan een woning in nieuwbouwproject de Nieuwe Stapperij te Veghel? Neem contact op met de verkopend makelaar.
€ 485.000
Cost of copper (estimated): € 11.550
2% transfer tax (€ 9.700) + notary (€ 1.150) + valuation (€ 700)
Total purchase (incl. p.p.): € 496.550
3,21%
Yearly
€ 24.250
Direct available
Estimated mortgage
Indicative gross monthly cost
Based on annuity and 30 year term
Indicative net monthly cost
iDisclaimer: this mortgage calculation is a simplified indication based on general assumptions. No rights can be derived from the results shown. Calculated with 10-annual interest (zonder NHG), automatically determined based on the price limit € 470.000. Source: 10-jaars rente uit mortgage_rates (08-06-2026 03:45). For non-NHG, an 80% mortgage of the market value has been used in this indication.
Douche, dubbele wastafel, en toilet
Spatial overview of the work area in Veghel
View current location data on residents, WOZ development, housing stock, energy consumption, business activity and safety in Veghel. In 2025 were there 34.805 residents. The average WOZ value in 2025 is EUR 416.000.
Residents
34.805
Last year: 2025
Average WOZ
EUR 416.000
Last year: 2025
Average income per person.
EUR 34.700
Source: AllNumbers
Crimes (current year)
1.185
Total registered
| Year | Residents |
|---|---|
| 2021 | 32.585 |
| 2022 | 33.345 |
| 2023 | 33.895 |
| 2024 | 34.455 |
| 2025 | 34.805 |
| Year | Average WOZ |
|---|---|
| 2021 | EUR 284.000 |
| 2022 | EUR 315.000 |
| 2023 | EUR 375.000 |
| 2024 | EUR 390.000 |
| 2025 | EUR 416.000 |
Hoger
7.640
Praktisch
7.110
Middelbaar
11.450
Europa
3.795
Nederland
25.630
Buiten Europa
5.375
Label A
4.312
Label C
4.307
Label B
2.841
Label D
1.129
Label F
600
Label G
594
Label A+++
585
Label A+
500
Label E
439
Label A++
316
Label A++++
134
Label A+++++
11
| Year | Gas (m3) | Electricity (kWh) |
|---|---|---|
| 2020 | 1.270 | 3.130 |
| 2021 | 1.410 | 3.190 |
| 2022 | 1.080 | 2.970 |
| 2023 | 910 | 2.850 |
| 2024 | 860 | 2.950 |
Hoekwoning
Gas: 920 • Electricity: 2.720
Huurwoning
Gas: 700 • Electricity: 2.030
Koopwoning
Gas: 1.000 • Electricity: 3.210
Appartement
Gas: 550 • Electricity: 1.860
Tussenwoning
Gas: 810 • Electricity: 2.520
Vrijstaande woning
Gas: 1.360 • Electricity: 4.340
Twee-onder-één-kap woning
Gas: 1.100 • Electricity: 3.400
Total number of company establishments: 4.485
| Period | Crimes |
|---|---|
| jan 2025 | 101 |
| jan 2026 | 93 |
| jul 2025 | 92 |
| jun 2025 | 91 |
| mei 2025 | 120 |
| mrt 2025 | 113 |
| nov 2024 | 91 |
| nov 2025 | 81 |
| okt 2024 | 85 |
| okt 2025 | 114 |
| sep 2024 | 83 |
| sep 2025 | 100 |
These figures give an indicative picture of safety trends in the living environment of Veghel.
Short answers based on current local statistics, handy for a quick comparison of the living environment.
Veghel telt in 2025 ongeveer 34.805 inwoners.
De gemiddelde WOZ-waarde in Veghel is in 2025 circa € 416.000.
Het gemiddelde inkomen per inwoner in Veghel ligt rond € 34.700 per jaar.
Voor het huidige jaar gaat het om ongeveer 1.185 geregistreerde misdrijven. Gebruik deze cijfers als indicatie en vergelijk trends per periode.
In Veghel komt vooral "Tussenwoningen" veel voor, met ongeveer 5.417 woningen.
View more homes in this location.
5463CS Veghel
€ 429.000 k.k.
€ 3.226/m²
5467AA Veghel
€ 439.000 k.k.
€ 3.326/m²
5461HK Veghel
€ 250.000 k.k.
€ 3.968/m²
5463LP Veghel
€ 1.050.000 k.k.
€ 4.054/m²

5463PB Veghel
€ 2.295.000 k.k.
€ 6.253/m²
5461AJ Veghel
€ 449.000 k.k.
€ 3.184/m²

5464PP Veghel
€ 835.000 k.k.
€ 4.014/m²

5461GX Veghel
€ 375.000 k.k.
€ 4.412/m²
