
Residents
70.045
Last year: 2025
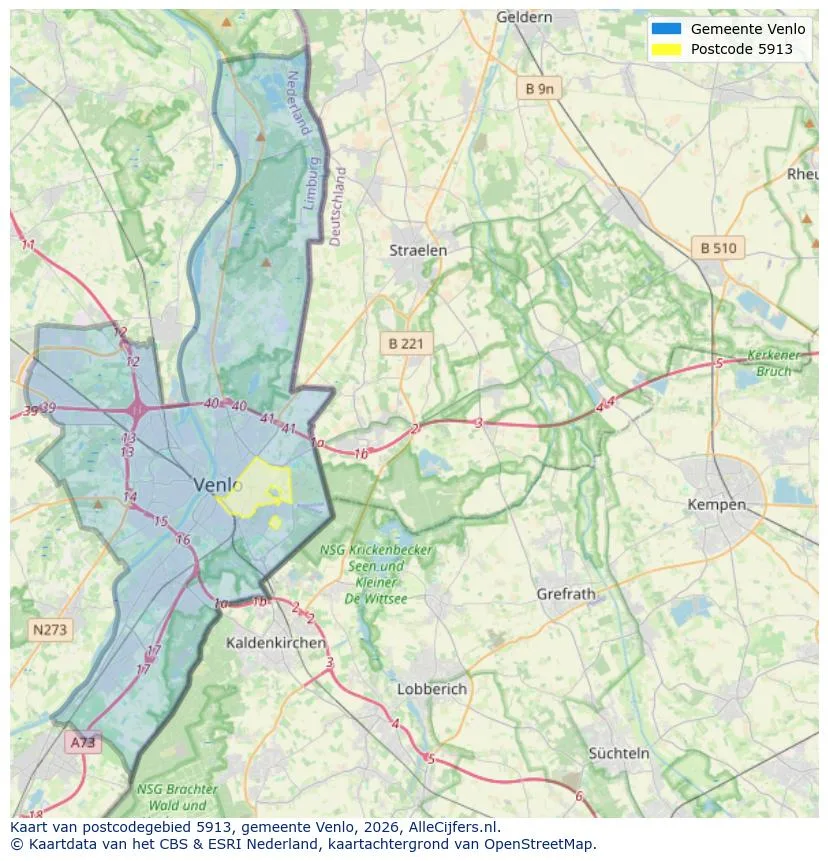
5913CC Venlo • Limburg
€ 350.000 k.k.
Cost of copper (estimated): € 8.850
2% transfer tax (€ 7.000) + notary (€ 1.150) + valuation (€ 700)
Total incl. VAT: € 358.850
Purchase price /m²: € 3.645
In goede staat door middel van 10 zonnepanelen in 2021 verduurzaamde tussenwoning welke in Venlo Oost aan hofje is gelegen met tuin op het zuidwesten met vrije achterom, aluminium overdekt terras (2008) met inbouwspotjes en aparte berging waarvan de buiten muren van binnen geïsoleerd zijn met PIR + OSB platen. Indeling: Provisiekelder. Begane grond: entree met garderobe en keramische tegelvloer. Zwevend toilet (2000). Woonkamer met laminaatvloer (vloer is in 2022 aan de onderzijde geïsoleerd). Nette keuken uit 2002 waarvan vrijwel alle apparatuur in 2021 en 2022 zijn vervangen (koelkast, diepvries, inductiekookplaat en vaatwasser), tevens beschikt de keuken over een afzuigkap en oven met spit. 1ste verdieping: overloop met laminaatvloer en muurkast (de muurkast is de voormalige badkamer welke uitermate geschikt is voor het plaatsen van het witgoed). 3 slaapkamers met laminaatvloer waarvan 2 met muurkast. Moderne badkamer (2004) met douche, wastafel, 2de zwevend toilet, designradiator. Middels Vlizotrap te bereiken zolderruimte waar de cv-ketel en omvormer zich bevinden. Bijzonderheden: bouwjaar 1961. Oppervlakte perceel 160m2. Woonoppervlakte 96m2. Overige inpandige ruimte 27m2. Gebouwgebonden buitenruimte 18m2. Externe buitenruimte 8m2. Inhoud 433m3. In 2021 is de spouwmuur geïsoleerd. In 2000 is de woning voorzien van nieuwe kunststof kozijnen met dubbele beglazing met op de begane grond rolluiken waarvan de voorzijde elektrisch te bedienen. Woning is in 2020 voorzien van een nieuwe HR Atag cv-ketel. Aanvaarding in overleg.
€ 350.000
Cost of copper (estimated): € 8.850
2% transfer tax (€ 7.000) + notary (€ 1.150) + valuation (€ 700)
Total purchase (incl. p.p.): € 358.850
2,78%
Yearly
€ 17.500
Direct available
Estimated mortgage
Indicative gross monthly cost
Based on annuity and 30 year term
Indicative net monthly cost
iDisclaimer: this mortgage calculation is a simplified indication based on general assumptions. No rights can be derived from the results shown. Calculated with 10-annual interest (met NHG), automatically determined based on the price limit € 470.000. Source: 10-jaars rente uit mortgage_rates (04-05-2026 03:45).
Discover where agents are active in Venlo
View current location data on residents, WOZ development, housing stock, energy consumption, business activity and safety in Venlo. In 2025 were there 70.045 residents. The average WOZ value in 2025 is EUR 308.186.
Residents
70.045
Last year: 2025
Average WOZ
EUR 308.186
Last year: 2025
Average income per person.
EUR 28.855
Source: AllNumbers
Crimes (current year)
4.868
Total registered
| Year | Residents |
|---|---|
| 2021 | 68.600 |
| 2022 | 68.680 |
| 2023 | 69.440 |
| 2024 | 69.795 |
| 2025 | 70.045 |
| Year | Average WOZ |
|---|---|
| 2021 | EUR 221.171 |
| 2022 | EUR 237.703 |
| 2023 | EUR 281.775 |
| 2024 | EUR 283.295 |
| 2025 | EUR 308.186 |
Hoger
14.350
Praktisch
17.080
Middelbaar
21.990
Europa
12.615
Nederland
44.545
Buiten Europa
12.885
Label C
9.166
Label A
7.392
Label B
6.085
Label D
3.311
Label E
2.910
Label F
2.302
Label G
2.015
Label A+
654
Label A++
427
Label A+++
418
Label A++++
239
Label A+++++
25
| Year | Gas (m3) | Electricity (kWh) |
|---|---|---|
| 2020 | 1.182 | 2.774 |
| 2021 | 1.327 | 2.800 |
| 2022 | 1.036 | 2.640 |
| 2023 | 868 | 2.522 |
| 2024 | 845 | 2.567 |
Hoekwoning
Gas: 1.016 • Electricity: 2.803
Huurwoning
Gas: 741 • Electricity: 2.001
Koopwoning
Gas: 991 • Electricity: 2.962
Appartement
Gas: 618 • Electricity: 1.798
Tussenwoning
Gas: 915 • Electricity: 2.645
Vrijstaande woning
Gas: 1.523 • Electricity: 4.267
Twee-onder-één-kap woning
Gas: 1.170 • Electricity: 3.229
Total number of company establishments: 8.690
| Period | Crimes |
|---|---|
| jan 2025 | 436 |
| jan 2026 | 396 |
| jul 2025 | 379 |
| jun 2025 | 396 |
| mei 2025 | 404 |
| mrt 2025 | 415 |
| nov 2024 | 449 |
| nov 2025 | 402 |
| okt 2024 | 403 |
| okt 2025 | 481 |
| sep 2024 | 359 |
| sep 2025 | 375 |
These figures give an indicative picture of safety trends in the living environment of Venlo.
Short answers based on current local statistics, handy for a quick comparison of the living environment.
Venlo telt in 2025 ongeveer 70.045 inwoners.
De gemiddelde WOZ-waarde in Venlo is in 2025 circa € 308.186.
Het gemiddelde inkomen per inwoner in Venlo ligt rond € 28.855 per jaar.
Voor het huidige jaar gaat het om ongeveer 4.868 geregistreerde misdrijven. Gebruik deze cijfers als indicatie en vergelijk trends per periode.
In Venlo komt vooral "Appartementen" veel voor, met ongeveer 13.528 woningen.
View more homes in this location.

5913GA Venlo
€ 235.000 k.k.

5915VJ Venlo
€ 475.000 k.k.

5915VV Venlo
€ 489.500 k.k.

5912KZ Venlo
€ 499.000 k.k.

5911KN Venlo
€ 449.500 k.k.

5921ED Venlo
€ 345.000 k.k.
€ 3.000/m²

5911BL Venlo
€ 795.000 k.k.
€ 3.614/m²

5915GE Venlo
€ 750.000 k.k.
€ 3.827/m²
