
Residents
8.020
Last year: 2025
6367SK Voerendaal • Limburg
For this property, no detailed description is available yet.
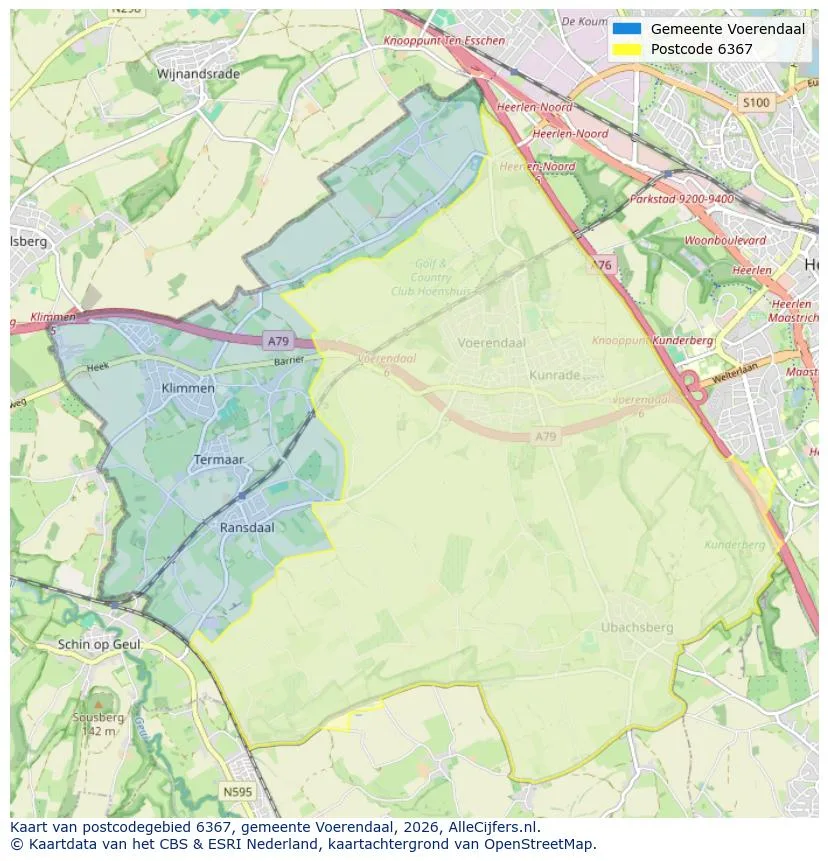
Geographic orientation and real estate agent density in Voerendaal
View current location data on residents, WOZ development, housing stock, energy consumption, business activity and safety in Voerendaal. In 2025 were there 8.020 residents. The average WOZ value in 2025 is EUR 334.618.
Residents
8.020
Last year: 2025
Average WOZ
EUR 334.618
Last year: 2025
Average income per person.
EUR 28.089
Source: AllNumbers
Crimes (current year)
213
Total registered
| Year | Residents |
|---|---|
| 2021 | 8.125 |
| 2022 | 8.075 |
| 2023 | 8.030 |
| 2024 | 7.980 |
| 2025 | 8.020 |
| Year | Average WOZ |
|---|---|
| 2021 | EUR 247.400 |
| 2022 | EUR 264.030 |
| 2023 | EUR 309.394 |
| 2024 | EUR 308.610 |
| 2025 | EUR 334.618 |
Hoger
2.020
Praktisch
1.270
Middelbaar
2.420
Europa
765
Nederland
6.765
Buiten Europa
485
Label C
997
Label B
673
Label A
641
Label D
543
Label F
434
Label G
361
Label E
219
Label A+
36
Label A++
21
Label A++++
8
Label A+++
7
Label A+++++
0
| Year | Gas (m3) | Electricity (kWh) |
|---|---|---|
| 2020 | 1.389 | 2.911 |
| 2021 | 1.600 | 2.984 |
| 2022 | 1.237 | 2.811 |
| 2023 | 1.010 | 2.732 |
| 2024 | 976 | 2.787 |
Hoekwoning
Gas: 979 • Electricity: 2.681
Huurwoning
Gas: 805 • Electricity: 2.060
Koopwoning
Gas: 1.114 • Electricity: 3.057
Appartement
Gas: 680 • Electricity: 1.756
Tussenwoning
Gas: 914 • Electricity: 2.568
Vrijstaande woning
Gas: 1.394 • Electricity: 3.782
Twee-onder-één-kap woning
Gas: 1.073 • Electricity: 2.759
Total number of company establishments: 825
| Period | Crimes |
|---|---|
| jan 2025 | 22 |
| jan 2026 | 11 |
| jul 2025 | 16 |
| jun 2025 | 18 |
| mei 2025 | 12 |
| mrt 2025 | 28 |
| nov 2024 | 19 |
| nov 2025 | 9 |
| okt 2024 | 18 |
| okt 2025 | 19 |
| sep 2024 | 25 |
| sep 2025 | 18 |
These figures give an indicative picture of safety trends in the living environment of Voerendaal.
Short answers based on current local statistics, handy for a quick comparison of the living environment.
Voerendaal telt in 2025 ongeveer 8.020 inwoners.
De gemiddelde WOZ-waarde in Voerendaal is in 2025 circa € 334.618.
Het gemiddelde inkomen per inwoner in Voerendaal ligt rond € 28.089 per jaar.
Voor het huidige jaar gaat het om ongeveer 213 geregistreerde misdrijven. Gebruik deze cijfers als indicatie en vergelijk trends per periode.
In Voerendaal komt vooral "Tussenwoningen" veel voor, met ongeveer 1.091 woningen.
View more homes in this location.

6367EP Voerendaal
€ 619.000 k.k.

6367EP Voerendaal
€ 538.000 k.k.

6367JL Voerendaal
€ 396.000 k.k.

6367BS Voerendaal
€ 385.000 k.k.

6367GW Voerendaal
€ 750 p/m
€ 21/m²

6367AE Voerendaal
€ 319.000 k.k.

6367VZ Voerendaal
€ 525.000 k.k.

6367MD Voerendaal
€ 479.000 k.k.
