
Residents
36.070
Last year: 2025
5141KK Waalwijk • Noord-Brabant
€ 269.000 k.k.
Cost of copper (estimated): € 7.230
2% transfer tax (€ 5.380) + notary (€ 1.150) + valuation (€ 700)
Total incl. VAT: € 276.230
Purchase price /m²: € 3.789
Heulstraat 58 in Waalwijk is een direct beschikbaar 3-kamerappartement van ongeveer 72 m² met balkon op het zuidwesten. Het appartement is recent volledig geschilderd aan de binnenzijde en is daarom direct te betrekken. Het biedt een centrale ligging in het hart van Waalwijk, op steenworp afstand van winkels, restaurants en andere dagelijkse voorzieningen. Vanaf de begane grond is er toegang tot een aparte berging, ideaal voor fietsen of extra opslag. Het appartement bestaalt uit een lichte woonkamer met toegang tot het zonnige balkon, een ruim opgezette keuken en twee goed gemeten slaapkamers. De badkamer is ruim en voorzien van ligbad, douche en wastafelmeubel. Er is ook een apart toilet. De buitenruimte in de vorm van een balkon op het zuidwesten is een heerlijke plek om te ontspannen. De locatie biedt uitstekende bereikbaarheid via de snelwegen N261, A59 en A58, met korte rijtijden naar Tilburg, Breda en ’s-Hertogenbosch. Het appartement is geschikt als hoofd- of logeerkamer en heeft een praktische indeling die aansluit bij diverse woonbehoeften. Het centrale karakter en de recente verbeteringen maken dit appartement een aantrekkelijke optie voor wie op zoek is naar een zonnige, comfortabele woning in het centrum van Waalwijk.
€ 269.000
Cost of copper (estimated): € 7.230
2% transfer tax (€ 5.380) + notary (€ 1.150) + valuation (€ 700)
Total purchase (incl. p.p.): € 276.230
3,02%
Yearly
€ 13.450
Direct available
Estimated mortgage
Indicative gross monthly cost
Based on annuity and 30 year term
Indicative net monthly cost
iDisclaimer: this mortgage calculation is a simplified indication based on general assumptions. No rights can be derived from the results shown. Calculated with 10-annual interest (met NHG), automatically determined based on the price limit € 470.000. Source: 10-jaars rente uit mortgage_rates (08-06-2026 03:45).
Douche, ligbad, en wastafelmeubel
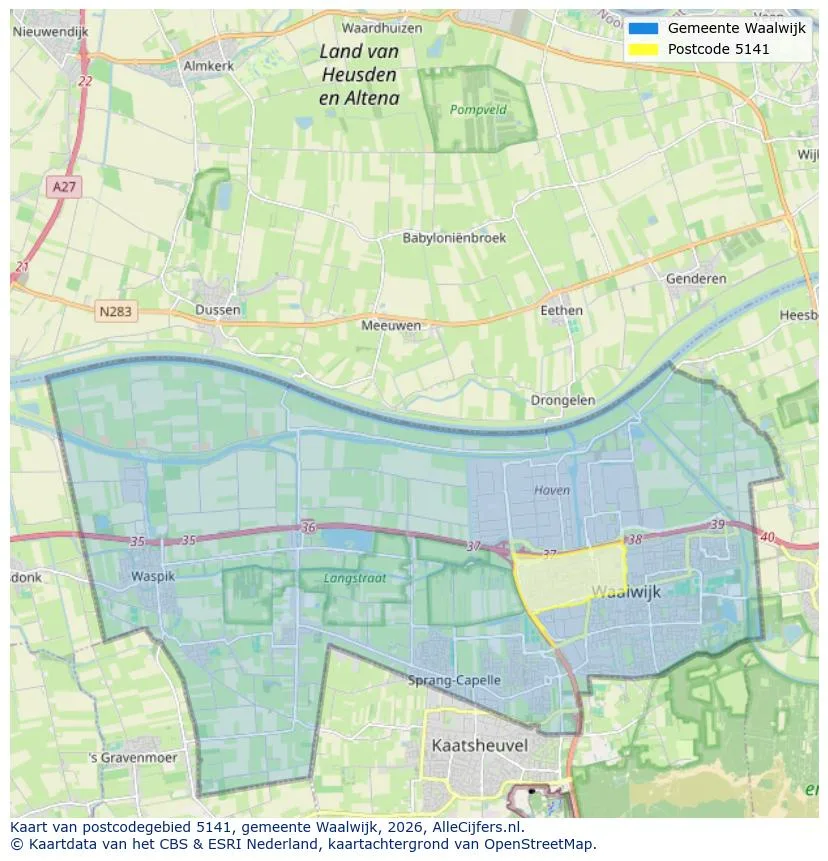
Discover where agents are active in Waalwijk
View current location data on residents, WOZ development, housing stock, energy consumption, business activity and safety in Waalwijk. In 2025 were there 36.070 residents. The average WOZ value in 2025 is EUR 359.426.
Residents
36.070
Last year: 2025
Average WOZ
EUR 359.426
Last year: 2025
Average income per person.
EUR 26.073
Source: AllNumbers
Crimes (current year)
1.439
Total registered
| Year | Residents |
|---|---|
| 2021 | 33.880 |
| 2022 | 34.415 |
| 2023 | 34.775 |
| 2024 | 35.060 |
| 2025 | 36.070 |
| Year | Average WOZ |
|---|---|
| 2021 | EUR 257.498 |
| 2022 | EUR 279.704 |
| 2023 | EUR 324.854 |
| 2024 | EUR 335.124 |
| 2025 | EUR 359.426 |
Hoger
5.620
Praktisch
8.070
Middelbaar
11.290
Europa
4.750
Nederland
25.670
Buiten Europa
5.635
Label A
4.481
Label C
4.342
Label B
2.608
Label D
1.377
Label E
877
Label G
745
Label F
743
Label A+++
439
Label A++++
428
Label A+
379
Label A++
366
Label A+++++
16
| Year | Gas (m3) | Electricity (kWh) |
|---|---|---|
| 2020 | 1.155 | 2.855 |
| 2021 | 1.288 | 2.895 |
| 2022 | 988 | 2.724 |
| 2023 | 852 | 2.574 |
| 2024 | 822 | 2.622 |
Hoekwoning
Gas: 964 • Electricity: 2.781
Huurwoning
Gas: 658 • Electricity: 1.995
Koopwoning
Gas: 975 • Electricity: 2.960
Appartement
Gas: 550 • Electricity: 1.766
Tussenwoning
Gas: 831 • Electricity: 2.597
Vrijstaande woning
Gas: 1.434 • Electricity: 4.057
Twee-onder-één-kap woning
Gas: 1.111 • Electricity: 3.244
Total number of company establishments: 4.860
| Period | Crimes |
|---|---|
| jan 2025 | 127 |
| jan 2026 | 112 |
| jul 2025 | 119 |
| jun 2025 | 95 |
| mei 2025 | 114 |
| mrt 2025 | 131 |
| nov 2024 | 125 |
| nov 2025 | 131 |
| okt 2024 | 150 |
| okt 2025 | 129 |
| sep 2024 | 106 |
| sep 2025 | 140 |
These figures give an indicative picture of safety trends in the living environment of Waalwijk.
Short answers based on current local statistics, handy for a quick comparison of the living environment.
Waalwijk telt in 2025 ongeveer 36.070 inwoners.
De gemiddelde WOZ-waarde in Waalwijk is in 2025 circa € 359.426.
Het gemiddelde inkomen per inwoner in Waalwijk ligt rond € 26.073 per jaar.
Voor het huidige jaar gaat het om ongeveer 1.439 geregistreerde misdrijven. Gebruik deze cijfers als indicatie en vergelijk trends per periode.
In Waalwijk komt vooral "Tussenwoningen" veel voor, met ongeveer 5.980 woningen.
View more homes in this location.

5142AA Waalwijk
€ 875.000 k.k.
€ 4.310/m²

5146AW Waalwijk
€ 379.000 k.k.
€ 5.192/m²

5144RE Waalwijk
€ 747 p/m
€ 57/m²

5141ET Waalwijk
€ 520.000 k.k.
€ 5.149/m²

5143CA Waalwijk
€ 375.000 k.k.
€ 3.827/m²

5141GM Waalwijk
€ 699.000 k.k.
€ 5.336/m²
5142EE Waalwijk
€ 298.000 k.k.
€ 3.506/m²
5146DV Waalwijk
€ 405.000 k.k.
€ 3.971/m²
