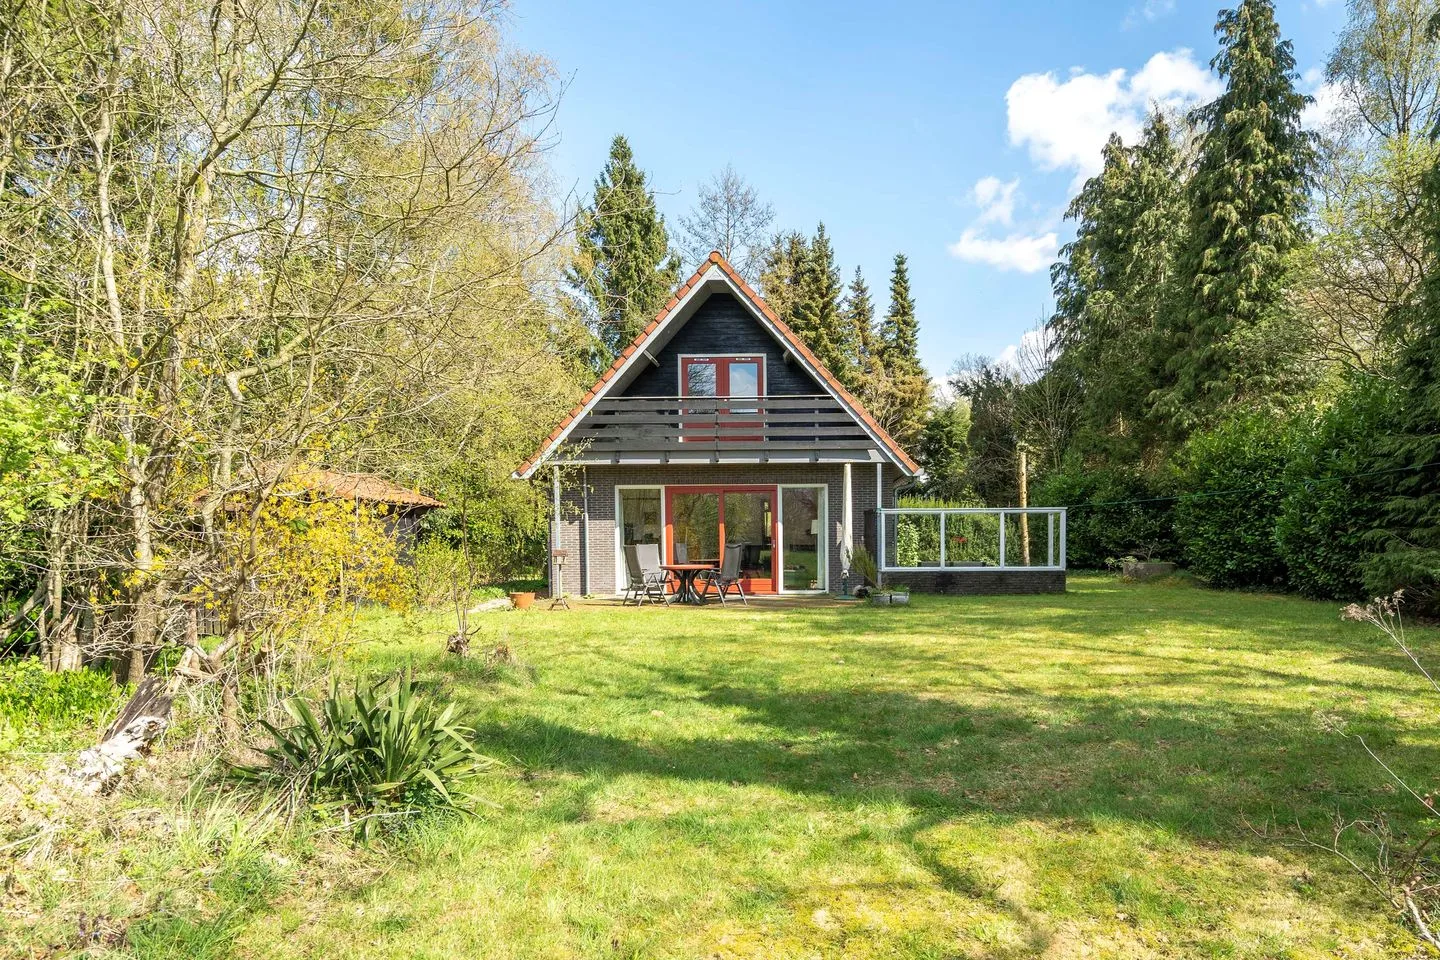
Houses sold in Wittelte

View 1 sold residence in Wittelte

Connected to: Vastgoed Nederland NVM Makelaars

On this page you will find recently sold homes in Wittelte. Use this overview to better estimate selling prices, popular neighborhoods, and the local housing supply before you choose a real estate agent. Also view the current housing supply with 2 houses in Wittelte.

Selection

Search and filter homes

Set your preferences and discover homes that suit you.

Total supply 243.449
Filters

Set price, area and other characteristics. Adjust a filter or click on Show homes. Location changes directly above.

Reset filters

You search for

  • Place Wittelte
  • Status Sold

Sell your house in Wittelte? Compare real estate agents

View recent sales and receive free quotes from local real estate agents. Compare more than 18 real estate agents in Wittelte.

Free request a quote

  • Quotes in Wittelte
  • Non-binding
  • Personal
  • Compare free rates

Selling your own home in Wittelte? Compare real estate agents in Wittelte or view the best real estate agents in Wittelte as a reference for your choice.

Compare multiple quotes

Real estate agents make sharper offers when they know you're comparing — ask for quotes for sale or purchase.

Frequently asked questions about sold homes in Wittelte

Short answers about housing prices, sold homes and comparing real estate agents in Wittelte.

Residential and neighborhood statistics in Wittelte

View current location data on residents, WOZ development, housing stock, energy consumption, business activity and safety in Wittelte. In 2026 were there 215 residents. The average WOZ value in 2025 is EUR 530.400.

These figures help to better assess and compare the housing stock in Wittelte with recent sold homes. Orient yourself then on suitable top real estate agents in Wittelte for sales advice in this region.

Residents

215

Last year: 2026

Average WOZ

EUR 530.400

Last year: 2025

Average income per person.

EUR 33.454

Source: AllNumbers

Crimes (current year)

2

Total registered

Demographics and WOZ development

Inhabitants per year

Inhabitants per year in Wittelte
Year Residents
2021 209
2022 219
2023 214
2024 220
2025 218
2026 215

Annual WOZ value

WOZ value per year in Wittelte
Year Average WOZ
2021 EUR 431.605
2022 EUR 454.395
2023 EUR 486.091
2024 EUR 506.591
2025 EUR 530.400

Composition of residents

Age build-up

65+: 76 0-15: 25 15-25: 10 25-45: 46 45-65: 60

Education level

Hoger

30

Praktisch

27

Middelbaar

28

Origin of residents (2025)

Europa

9

Nederland

204

Buiten Europa

9

Housing stock and construction periods

Types of homes

Appartementen 5
Vrijstaande woningen 83
Twee-onder-één-kap woningen 6

Construction period of buildings

Voor 1700 2
1700 tot 1900 7
1900 tot 1925 25
1925 tot 1950 28
1950 tot 1970 22
1970 tot 1980 29
1980 tot 1990 4
1990 tot 2000 9
2000 tot 2010 13
2010 tot 2020 0
2020 en later 2

Energy and sustainability

Energy label distribution

Label C

41

Label G

31

Label D

17

Label B

16

Label A

12

Label F

11

Label E

1

Label A+++

1

Label A+

0

Label A++

0

Label A++++

0

Label A+++++

0

Average energy consumption per year

Average energy consumption per year in Wittelte
Year Gas (m3) Electricity (kWh)
2020 2.228 4.111
2021 2.458 4.262
2022 1.836 4.199
2023 1.465 3.837
2024 1.409 3.929

Consumption per house type

Huurwoning

Gas: 1.029 • Electricity: 2.994

Koopwoning

Gas: 1.553 • Electricity: 4.015

Appartement

Gas: 53 • Electricity: 1.285

Vrijstaande woning

Gas: 1.608 • Electricity: 4.007

Twee-onder-één-kap woning

Gas: 434 • Electricity: 1.375

Business activity in Wittelte (2025)

Handel en HORECA 8
Nijverheid en energie 7
Zakelijke dienstverlening 9
Overheid, onderwijs en zorg 8
Landbouw, bosbouw en visserij 18
Vervoer, informatie en communicatie 0
Financiele diensten en onroerendgoed 1
Cultuur, recreatie en overige diensten 7

Total number of company establishments: 56

Recent crime statistics

Recent crime statistics in Wittelte
Period Crimes
jan 2026 0
jul 2025 0
jun 2025 0
mei 2025 1
mrt 2025 0
mrt 2026 0
nov 2024 0
nov 2025 1
okt 2024 0
okt 2025 0
sep 2024 1
sep 2025 0

These figures give an indicative picture of safety trends in the living environment of Wittelte.

Frequently asked questions about living in Wittelte

Short answers based on current local statistics, handy for a quick comparison of the living environment.

Hoeveel inwoners heeft Wittelte?

Wittelte telt in 2026 ongeveer 215 inwoners.

Wat is de gemiddelde WOZ-waarde in Wittelte?

De gemiddelde WOZ-waarde in Wittelte is in 2025 circa € 530.400.

Wat is het gemiddelde inkomen per inwoner in Wittelte?

Het gemiddelde inkomen per inwoner in Wittelte ligt rond € 33.454 per jaar.

Hoe veilig is wonen in Wittelte?

Voor het huidige jaar gaat het om ongeveer 2 geregistreerde misdrijven. Gebruik deze cijfers als indicatie en vergelijk trends per periode.

Welke woningtypen komen het meest voor in Wittelte?

In Wittelte komt vooral "Vrijstaande woningen" veel voor, met ongeveer 83 woningen.

Receive free, non-binding quotes

Compare multiple real estate agents and choose the best match.