
Residents
24.610
Last year: 2026
3894CP Zeewolde • Flevoland
For this property, no detailed description is available yet.
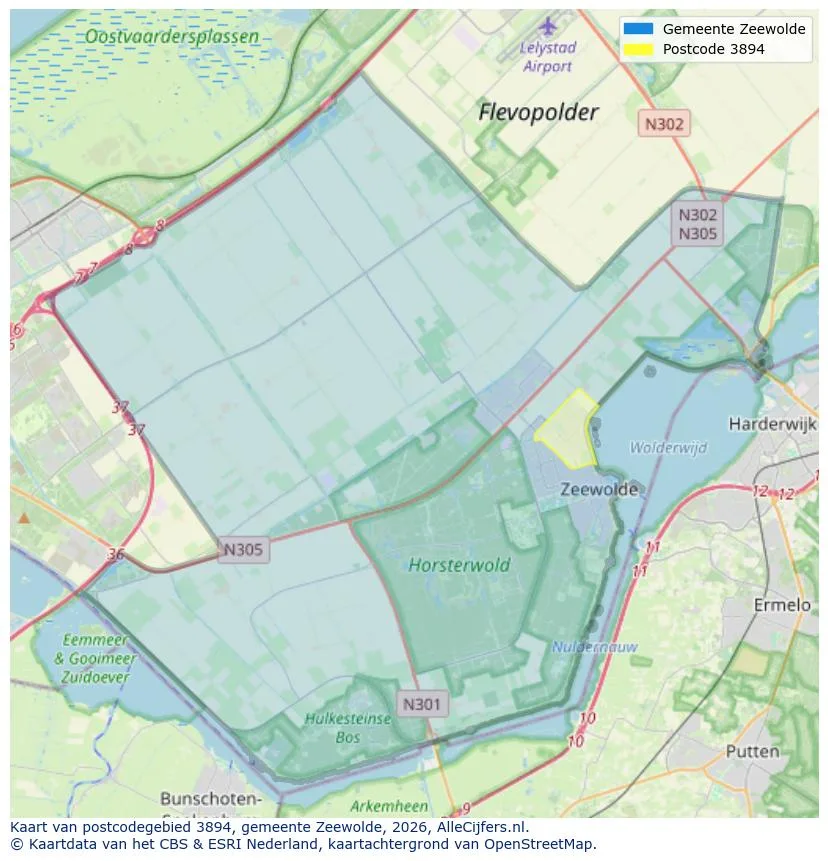
View the location and discover the brokers in this region
View current location data on residents, WOZ development, housing stock, energy consumption, business activity and safety in Zeewolde. In 2026 were there 24.610 residents. The average WOZ value in 2025 is EUR 423.000.
Residents
24.610
Last year: 2026
Average WOZ
EUR 423.000
Last year: 2025
Average income per person.
EUR 35.900
Source: AllNumbers
Crimes (current year)
776
Total registered
| Year | Residents |
|---|---|
| 2022 | 23.348 |
| 2023 | 23.692 |
| 2024 | 23.899 |
| 2025 | 24.291 |
| 2026 | 24.610 |
| Year | Average WOZ |
|---|---|
| 2021 | EUR 305.000 |
| 2022 | EUR 331.000 |
| 2023 | EUR 393.000 |
| 2024 | EUR 413.000 |
| 2025 | EUR 423.000 |
Hoger
32
Praktisch
22
Middelbaar
46
Europa
2.628
Nederland
18.756
Buiten Europa
2.907
Label A
4.503
Label B
3.030
Label C
2.993
Label A+
480
Label A++
392
Label A+++
339
Label A++++
73
Label D
48
Label E
41
Label F
17
Label G
7
Label A+++++
5
| Year | Gas (m3) | Electricity (kWh) |
|---|---|---|
| 2020 | 920 | 3.050 |
| 2021 | 1.030 | 3.100 |
| 2022 | 790 | 2.890 |
| 2023 | 660 | 2.740 |
| 2024 | 620 | 2.830 |
Hoekwoning
Gas: 640 • Electricity: 2.770
Huurwoning
Gas: 530 • Electricity: 2.060
Koopwoning
Gas: 720 • Electricity: 3.030
Appartement
Gas: 420 • Electricity: 1.860
Tussenwoning
Gas: 600 • Electricity: 2.580
Vrijstaande woning
Gas: 1.180 • Electricity: 4.030
Twee-onder-één-kap woning
Gas: 750 • Electricity: 3.570
Total number of company establishments: 3.725
| Period | Crimes |
|---|---|
| jan 2026 | 36 |
| jul 2025 | 74 |
| jun 2025 | 94 |
| mei 2025 | 49 |
| mrt 2025 | 94 |
| mrt 2026 | 52 |
| nov 2024 | 70 |
| nov 2025 | 36 |
| okt 2024 | 74 |
| okt 2025 | 58 |
| sep 2024 | 63 |
| sep 2025 | 46 |
These figures give an indicative picture of safety trends in the living environment of Zeewolde.
Short answers based on current local statistics, handy for a quick comparison of the living environment.
Zeewolde telt in 2026 ongeveer 24.610 inwoners.
De gemiddelde WOZ-waarde in Zeewolde is in 2025 circa € 423.000.
Het gemiddelde inkomen per inwoner in Zeewolde ligt rond € 35.900 per jaar.
Voor het huidige jaar gaat het om ongeveer 776 geregistreerde misdrijven. Gebruik deze cijfers als indicatie en vergelijk trends per periode.
In Zeewolde komt vooral "Tussenwoningen" veel voor, met ongeveer 4.605 woningen.
View more homes in this location.

3893HH Zeewolde
€ 885.000 k.k.

3898LL Zeewolde
€ 595.000 k.k.

3894CL Zeewolde
€ 375.000 k.k.

3894GM Zeewolde
€ 650.000 k.k.

3894GL Zeewolde
€ 395.000 k.k.

3891EE Zeewolde
€ 599.000 k.k.
3892HN Zeewolde
€ 370.000 k.k.

3894DP Zeewolde
€ 569.000 k.k.
