
Residents
2.030
Last year: 2025
7136KJ Zieuwent • Gelderland

For this property, no detailed description is available yet.
€ 395.000
Cost of copper (estimated): € 9.750
2% transfer tax (€ 7.900) + notary (€ 1.150) + valuation (€ 700)
Total purchase (incl. p.p.): € 404.750
2,78%
Yearly
€ 19.750
Direct available
Estimated mortgage
Indicative gross monthly cost
Based on annuity and 30 year term
Indicative net monthly cost
iDisclaimer: this mortgage calculation is a simplified indication based on general assumptions. No rights can be derived from the results shown. Calculated with 10-annual interest (met NHG), automatically determined based on the price limit € 470.000. Source: 10-jaars rente uit mortgage_rates (04-05-2026 03:45).
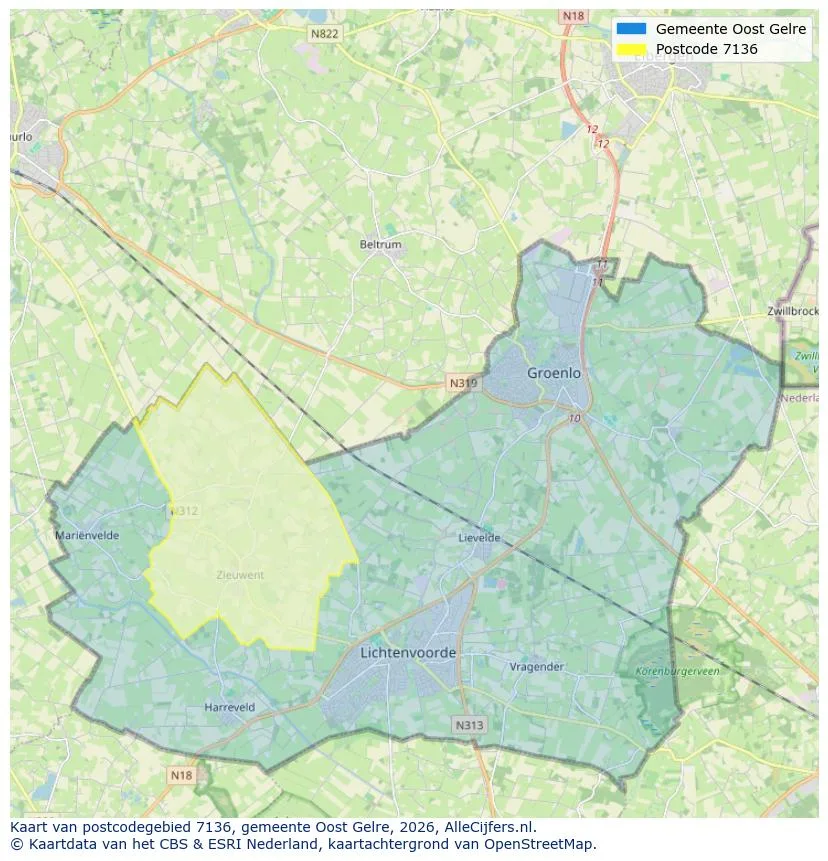
Spatial overview of the work area in Zieuwent
View current location data on residents, WOZ development, housing stock, energy consumption, business activity and safety in Zieuwent. In 2025 were there 2.030 residents. The average WOZ value in 2025 is EUR 392.000.
Residents
2.030
Last year: 2025
Average WOZ
EUR 392.000
Last year: 2025
Average income per person.
EUR 31.900
Source: AllNumbers
Crimes (current year)
19
Total registered
| Year | Residents |
|---|---|
| 2021 | 1.980 |
| 2022 | 1.995 |
| 2023 | 2.000 |
| 2024 | 1.995 |
| 2025 | 2.030 |
| Year | Average WOZ |
|---|---|
| 2021 | EUR 285.000 |
| 2022 | EUR 301.000 |
| 2023 | EUR 329.000 |
| 2024 | EUR 350.000 |
| 2025 | EUR 392.000 |
Hoger
420
Praktisch
320
Middelbaar
840
Europa
50
Nederland
1.935
Buiten Europa
45
Label B
156
Label C
151
Label G
128
Label A
94
Label D
91
Label F
69
Label A++++
30
Label E
25
Label A+
12
Label A++
8
Label A+++
8
Label A+++++
0
| Year | Gas (m3) | Electricity (kWh) |
|---|---|---|
| 2020 | 1.610 | 3.640 |
| 2021 | 1.810 | 3.630 |
| 2022 | 1.410 | 3.390 |
| 2023 | 1.090 | 3.300 |
| 2024 | 1.040 | 3.450 |
Hoekwoning
Gas: 810 • Electricity: 2.080
Huurwoning
Gas: 900 • Electricity: 2.470
Koopwoning
Gas: 1.120 • Electricity: 3.450
Appartement
Gas: 950 • Electricity: 2.980
Tussenwoning
Gas: 780 • Electricity: 2.150
Vrijstaande woning
Gas: 1.240 • Electricity: 3.780
Twee-onder-één-kap woning
Gas: 1.060 • Electricity: 3.340
Total number of company establishments: 295
| Period | Crimes |
|---|---|
| jan 2025 | 2 |
| jan 2026 | 2 |
| jul 2025 | 2 |
| jun 2025 | 1 |
| mei 2025 | 3 |
| mrt 2025 | 1 |
| nov 2024 | 1 |
| nov 2025 | 3 |
| okt 2024 | 0 |
| okt 2025 | 3 |
| sep 2024 | 1 |
| sep 2025 | 1 |
These figures give an indicative picture of safety trends in the living environment of Zieuwent.
Short answers based on current local statistics, handy for a quick comparison of the living environment.
Zieuwent telt in 2025 ongeveer 2.030 inwoners.
De gemiddelde WOZ-waarde in Zieuwent is in 2025 circa € 392.000.
Het gemiddelde inkomen per inwoner in Zieuwent ligt rond € 31.900 per jaar.
Voor het huidige jaar gaat het om ongeveer 19 geregistreerde misdrijven. Gebruik deze cijfers als indicatie en vergelijk trends per periode.
In Zieuwent komt vooral "Vrijstaande woningen" veel voor, met ongeveer 418 woningen.
View more homes in this location.

7136MB Zieuwent
€ 475.000 k.k.
€ 3.105/m²

7136KR Zieuwent
€ 675.000 k.k.
€ 4.412/m²

7136LR Zieuwent
€ 389.000 k.k.
€ 2.462/m²

7136LR Zieuwent
€ 265.000 k.k.
€ 3.840/m²

7136LZ Zieuwent
€ 299.000 k.k.
€ 3.934/m²

7136LE Zieuwent
€ 459.000 k.k.
€ 7.780/m²

7136LE Zieuwent
€ 339.000 k.k.
€ 2.778/m²

7136MN Zieuwent
€ 419.500 k.k.
€ 3.495/m²
