- Vendido
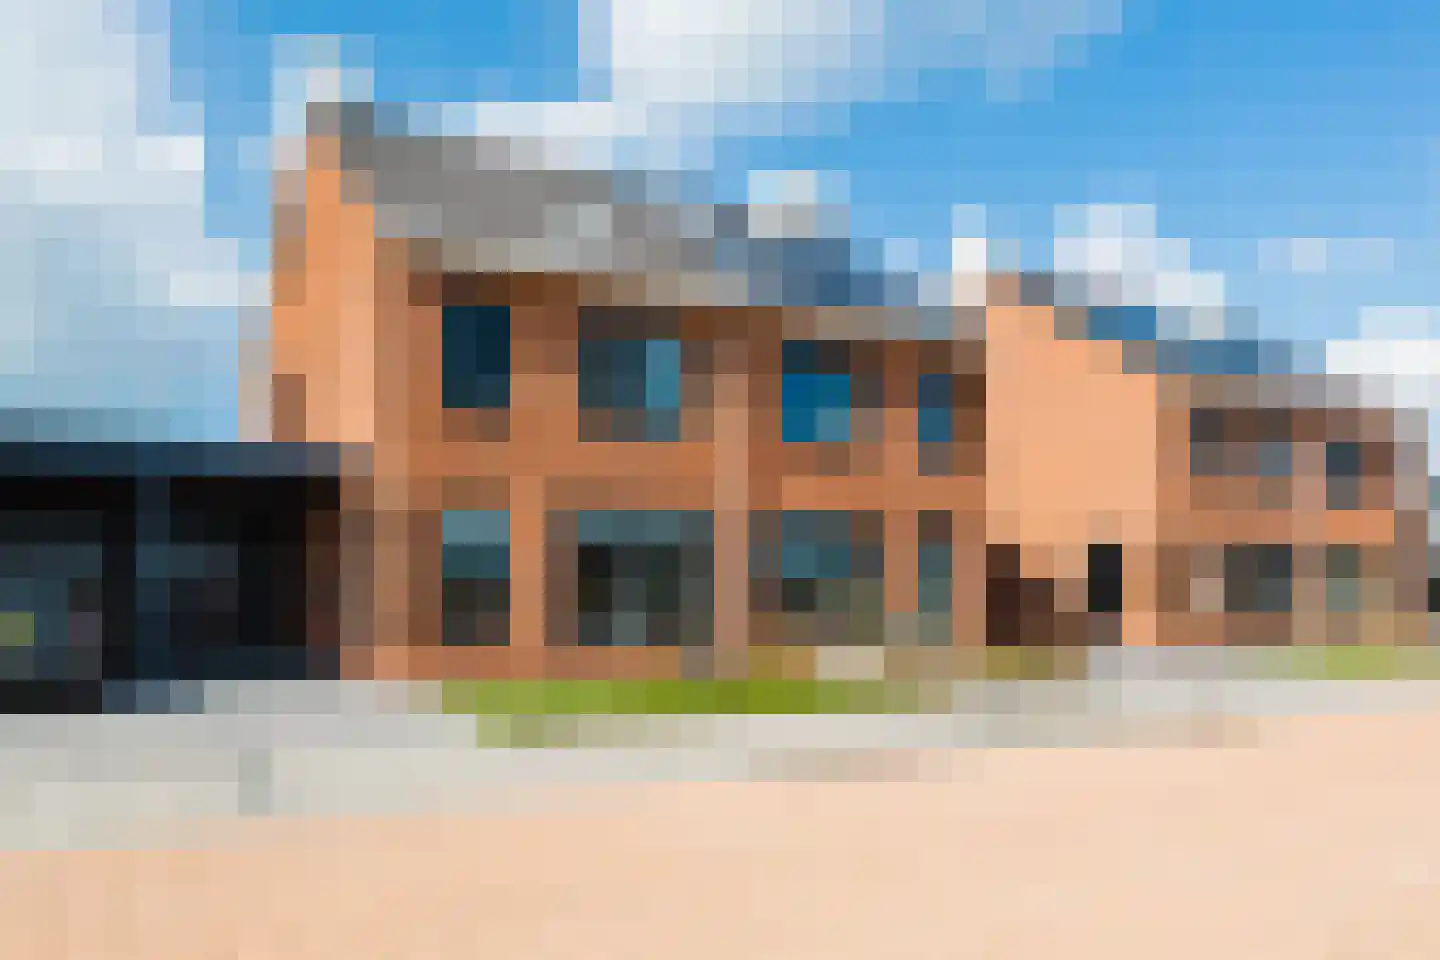
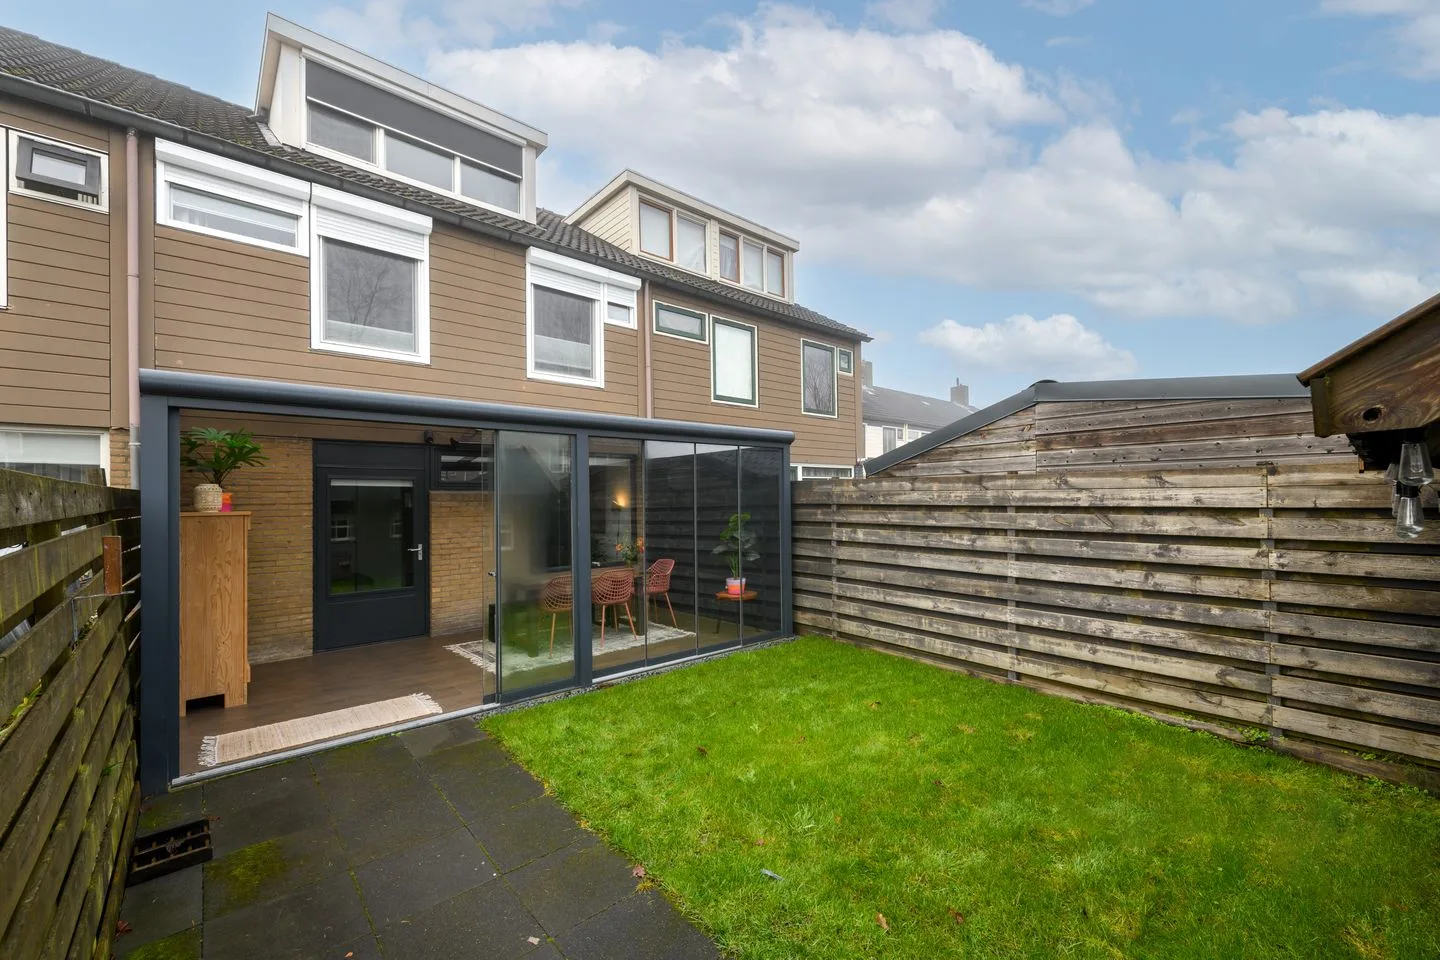
Jan Eisengastrjitte 52
8401EA Gorredijk
€ 275.000 k.k.
€ 3.667/m²
- Superficie construida
- 75 m²
- Área del lote
- 303 m²
- Habitaciones de dormir
- 3
Ver 89 vendido por viviendas en Gorredijk
Escribe para buscar. Usa la flecha hacia abajo y la flecha hacia arriba para navegar por los resultados y pulsa Intro para abrir.
Sugerencias de búsqueda ocultas.
Compare las viviendas vendidas en Gorredijk o mire directamente el oferta actual en este lugar.
En esta página encontrarás casas recientemente vendidas en Gorredijk. Usa este resumen para estimar mejor los precios de venta, los barrios populares y la oferta local de viviendas antes de elegir un agente inmobiliario. También puedes ver el oferta actual de viviendas con 121 viviendas en Gorredijk.
8401EA Gorredijk
€ 275.000 k.k.
€ 3.667/m²
8401LD Gorredijk
€ 495.000 k.k.
8401RV Gorredijk
€ 340.000 k.k.
€ 3.656/m²
8401NE Gorredijk
€ 499.500 k.k.
€ 3.398/m²
8401EB Gorredijk
€ 275.000 k.k.
€ 2.331/m²
8401CZ Gorredijk
€ 485.000 k.k.
€ 5.052/m²
8401RP Gorredijk
€ 259.500 k.k.
€ 2.732/m²
8401PX Gorredijk
€ 349.000 k.k.
€ 3.061/m²
8401CT Gorredijk
€ 299.500 k.k.
€ 3.186/m²
8401TK Gorredijk
€ 485.000 k.k.
€ 3.789/m²
8401VB Gorredijk
Precio bajo petición
8401NK Gorredijk
€ 475.000 k.k.
€ 3.544/m²
8401TV Gorredijk
€ 225.000 k.k.
€ 2.500/m²
8401AM Gorredijk
€ 405.000 k.k.
€ 4.010/m²
8401SK Gorredijk
€ 339.500 k.k.
€ 3.361/m²
8401XA Gorredijk
€ 495.000 k.k.
€ 4.057/m²
8401RW Gorredijk
€ 248.000 k.k.
€ 2.695/m²
8401ST Gorredijk
€ 315.000 k.k.
€ 2.520/m²
8401WX Gorredijk
€ 246.000 k.k.
€ 2.795/m²
8401TR Gorredijk
€ 289.500 k.k.
€ 2.608/m²
8401DN Gorredijk
€ 725.000 k.k.
€ 4.677/m²
8401CZ Gorredijk
€ 285.000 k.k.
€ 4.071/m²
8401DG Gorredijk
€ 330.000 k.k.
€ 3.626/m²
8401WG Gorredijk
€ 249.500 k.k.
€ 2.598/m²
8401PR Gorredijk
€ 315.000 k.k.
€ 2.405/m²
8401XX Gorredijk
€ 599.500 k.k.
€ 4.134/m²
8401NK Gorredijk
€ 449.500 k.k.
€ 3.684/m²
8401CG Gorredijk
€ 319.000 k.k.
€ 2.184/m²
Bekijk recente verkopen en ontvang gratis offertes van lokale makelaars. Vergelijk meer dan 28 makelaars in Gorredijk.
Recent verkocht in Gorredijk? Lees de verkoopgerichte gids huis verkopen in Gorredijk, vergelijk verkoopmakelaars in Gorredijk of bekijk de beste verkoopmakelaars in Gorredijk voor referentie bij jouw keuze.
Makelaars maken scherpere voorstellen als ze weten dat je vergelijkt — vraag offertes aan voor verkoop of aankoop.
Respuestas cortas sobre precios de viviendas, viviendas vendidas y comparar agentes inmobiliarios en Gorredijk.
De kosten van een makelaar in Gorredijk verschillen per kantoor, woningtype en verkoopaanpak. In Gorredijk kun je 28 agentes inmobiliarios vergelijken; bekijk daarom ook de makelaars in Gorredijk om tarieven, presentatie en lokale ervaring beter naast elkaar te zetten.
En esta página mostramos actualmente 89 vendidos viviendas en Gorredijk dentro de nuestra selección. Esto te ayuda a evaluar mejor las transacciones recientes y el mercado inmobiliario local.
Viviendas vendidas en Gorredijk dan una visión de los precios de demanda, tipos de vivienda y vecindarios donde han tenido lugar recientemente transacciones. Compara esto también con el oferta actual de viviendas en Gorredijk para comprender mejor el mercado.
Je kunt verkochte woningen gebruiken als eerste marktindicatie, maar een lokale makelaar kan beter rekening houden met afwerking, ligging, onderhoud en actuele vraag in Gorredijk. Plan de volgende stap via de gids huis verkopen in Gorredijk.
Vergelijk de 28 agentes inmobiliarios in Gorredijk op lokale verkoopervaring, reviews, verwachte opbrengst, courtage en marketingaanpak. Bekijk verkoopmakelaars in Gorredijk of de top 10 makelaars in Gorredijk om snel sterke kantoren te ontdekken.
Ver vista de datos actuales sobre residentes, desarrollo WOZ, stock de viviendas, consumo energético, actividad empresarial y seguridad en Gorredijk. En 2025 había 7.480 habitantes. El valor medio de la WOZ en 2025 es EUR 292.000.
Estos números ayudan a evaluar mejor y comparar el mercado inmobiliario en Gorredijk con las viviendas vendidas recientemente. Oriéntate después en mejores agentes inmobiliarios en Gorredijk adecuados para consejos de venta en esta región.
Inhabitantes
7.480
Último año: 2025
Promedio WOZ
EUR 292.000
Último año: 2025
Ingreso promedio por persona
EUR 29.900
Fuente: AlleCijfers
Delitos (año actual)
133
Total registrado
| Año | Inhabitantes |
|---|---|
| 2021 | 7.415 |
| 2022 | 7.325 |
| 2023 | 7.430 |
| 2024 | 7.525 |
| 2025 | 7.480 |
| Año | Promedio WOZ |
|---|---|
| 2021 | EUR 216.000 |
| 2022 | EUR 238.000 |
| 2023 | EUR 277.000 |
| 2024 | EUR 285.000 |
| 2025 | EUR 292.000 |
Hoger
1.450
Praktisch
1.460
Middelbaar
2.440
Europa
360
Nederland
6.600
Buiten Europa
520
Etiqueta A
1.120
Etiqueta C
839
Etiqueta B
587
Etiqueta D
346
Etiqueta G
332
Etiqueta F
171
Etiqueta E
116
Etiqueta A+++
112
Etiqueta A++++
81
Etiqueta A+
41
Etiqueta A++
25
Etiqueta A+++++
2
| Año | Gas (m3) | Electricidad (kWh) |
|---|---|---|
| 2020 | 1.300 | 2.660 |
| 2021 | 1.380 | 2.740 |
| 2022 | 1.080 | 2.560 |
| 2023 | 910 | 2.460 |
| 2024 | 860 | 2.560 |
Hoekwoning
Gas: 860 • Electricidad: 2.440
Huurwoning
Gas: 690 • Electricidad: 2.070
Koopwoning
Gas: 1.050 • Electricidad: 2.710
Appartement
Gas: 600 • Electricidad: 1.650
Tussenwoning
Gas: 810 • Electricidad: 2.220
Vrijstaande woning
Gas: 1.210 • Electricidad: 3.250
Twee-onder-één-kap woning
Gas: 940 • Electricidad: 2.460
Número total de establecimientos empresariales: 925
| Periodo | Delitos |
|---|---|
| jan 2025 | 12 |
| jan 2026 | 10 |
| jul 2025 | 16 |
| jun 2025 | 8 |
| mei 2025 | 11 |
| mrt 2025 | 17 |
| nov 2024 | 10 |
| nov 2025 | 9 |
| okt 2024 | 15 |
| okt 2025 | 16 |
| sep 2024 | 6 |
| sep 2025 | 8 |
Estos números dan una imagen indicativa de las tendencias de seguridad en el entorno residencial de Gorredijk.
Respuestas cortas basadas en cifras actuales de la zona, útil para una comparación rápida del entorno residencial.
Gorredijk telt in 2025 ongeveer 7.480 inwoners.
De gemiddelde WOZ-waarde in Gorredijk is in 2025 circa € 292.000.
Het gemiddelde inkomen per inwoner in Gorredijk ligt rond € 29.900 per jaar.
Voor het huidige jaar gaat het om ongeveer 133 geregistreerde misdrijven. Gebruik deze cijfers als indicatie en vergelijk trends per periode.
In Gorredijk komt vooral "Vrijstaande woningen" veel voor, met ongeveer 989 woningen.