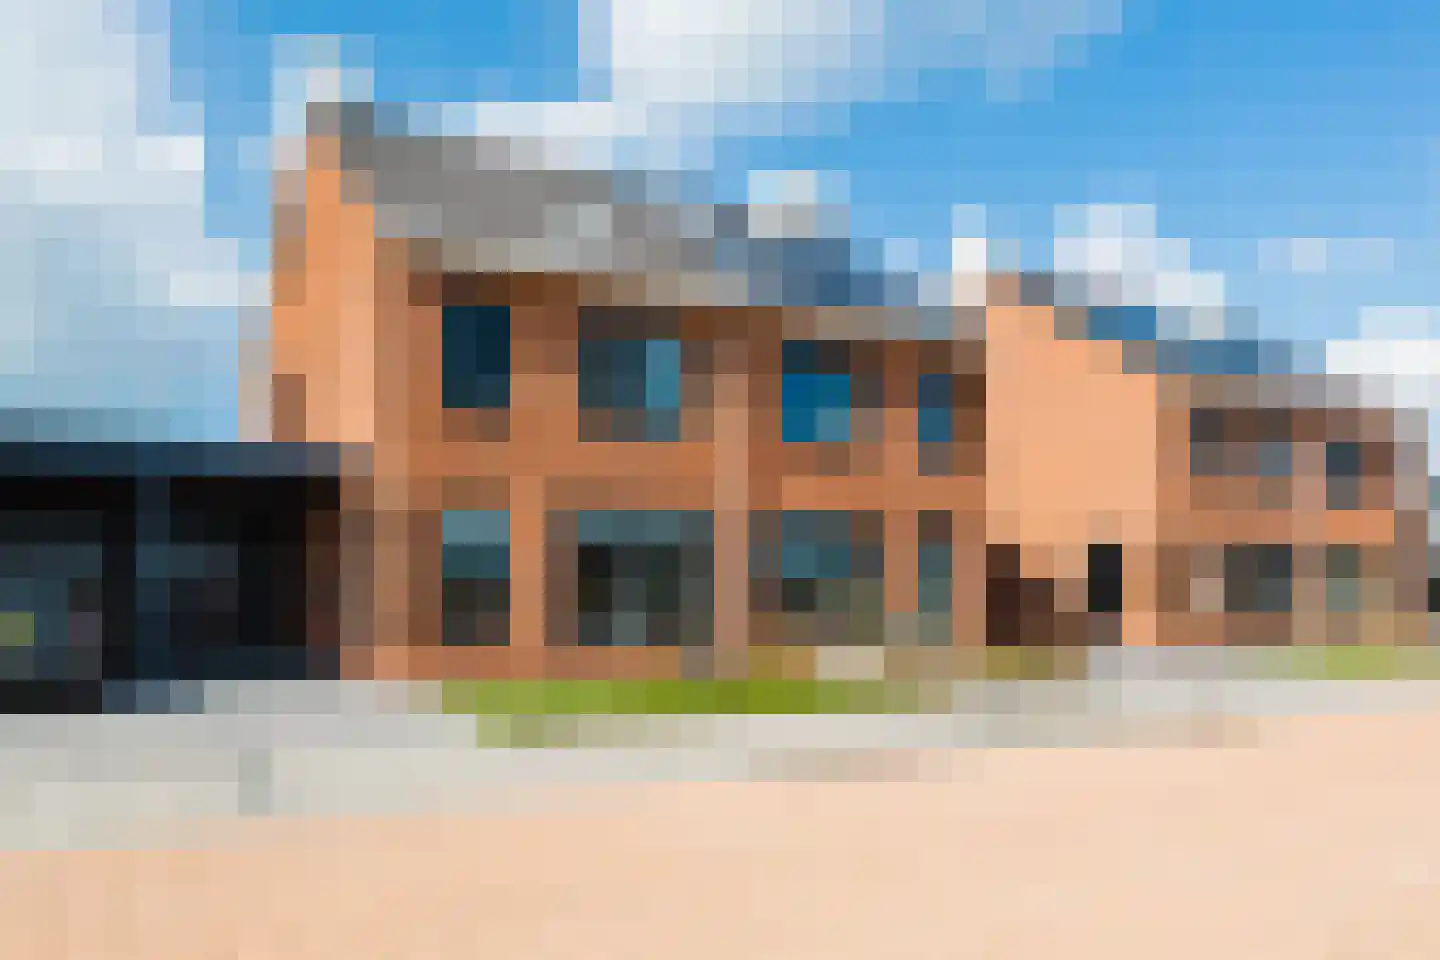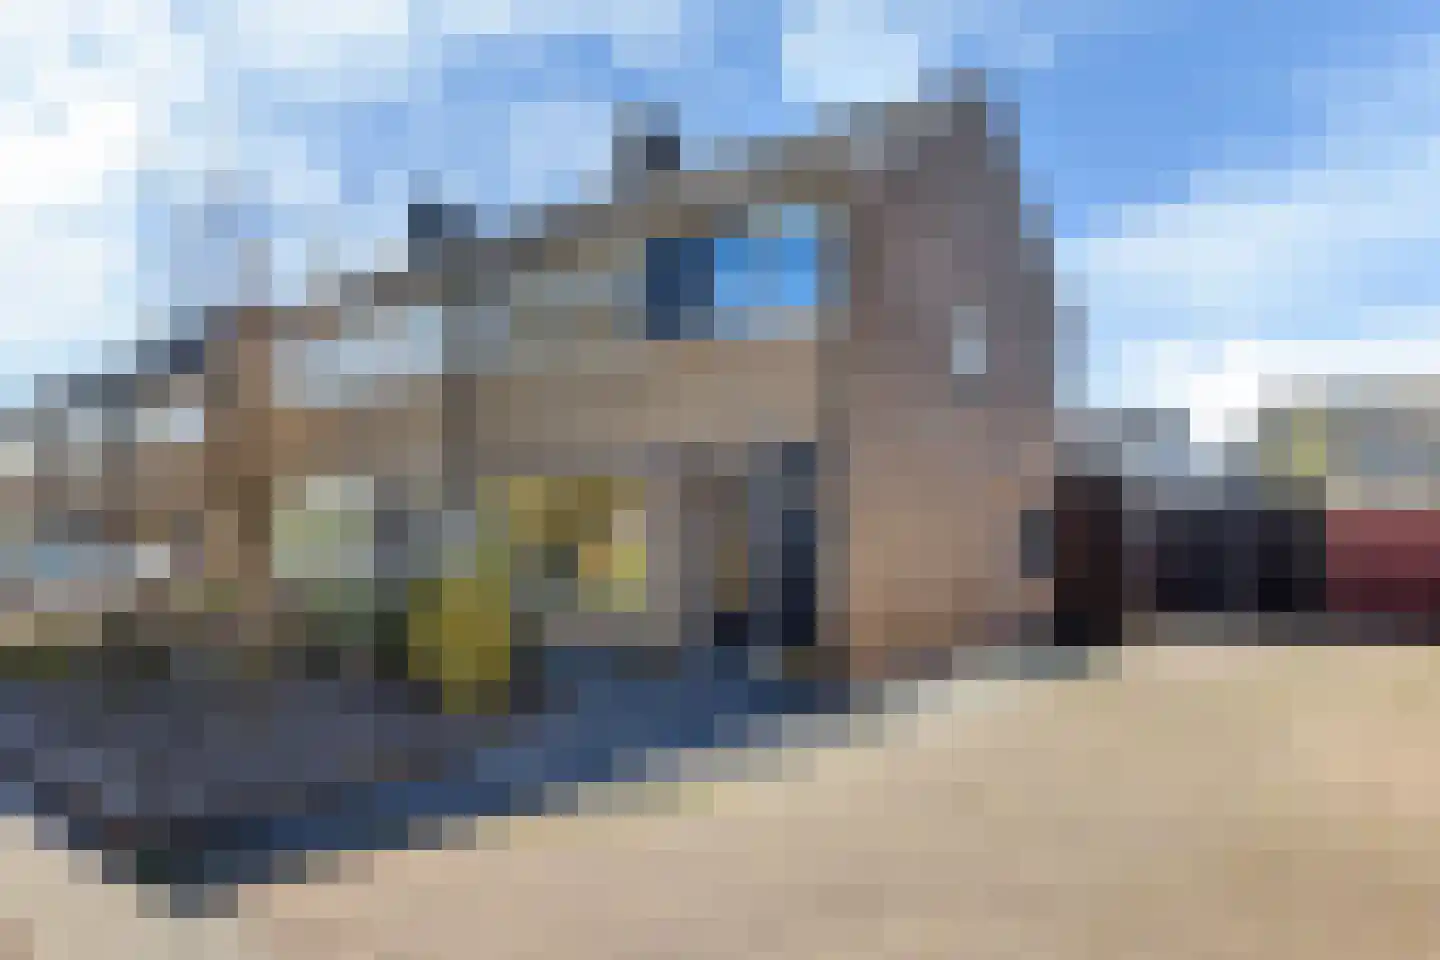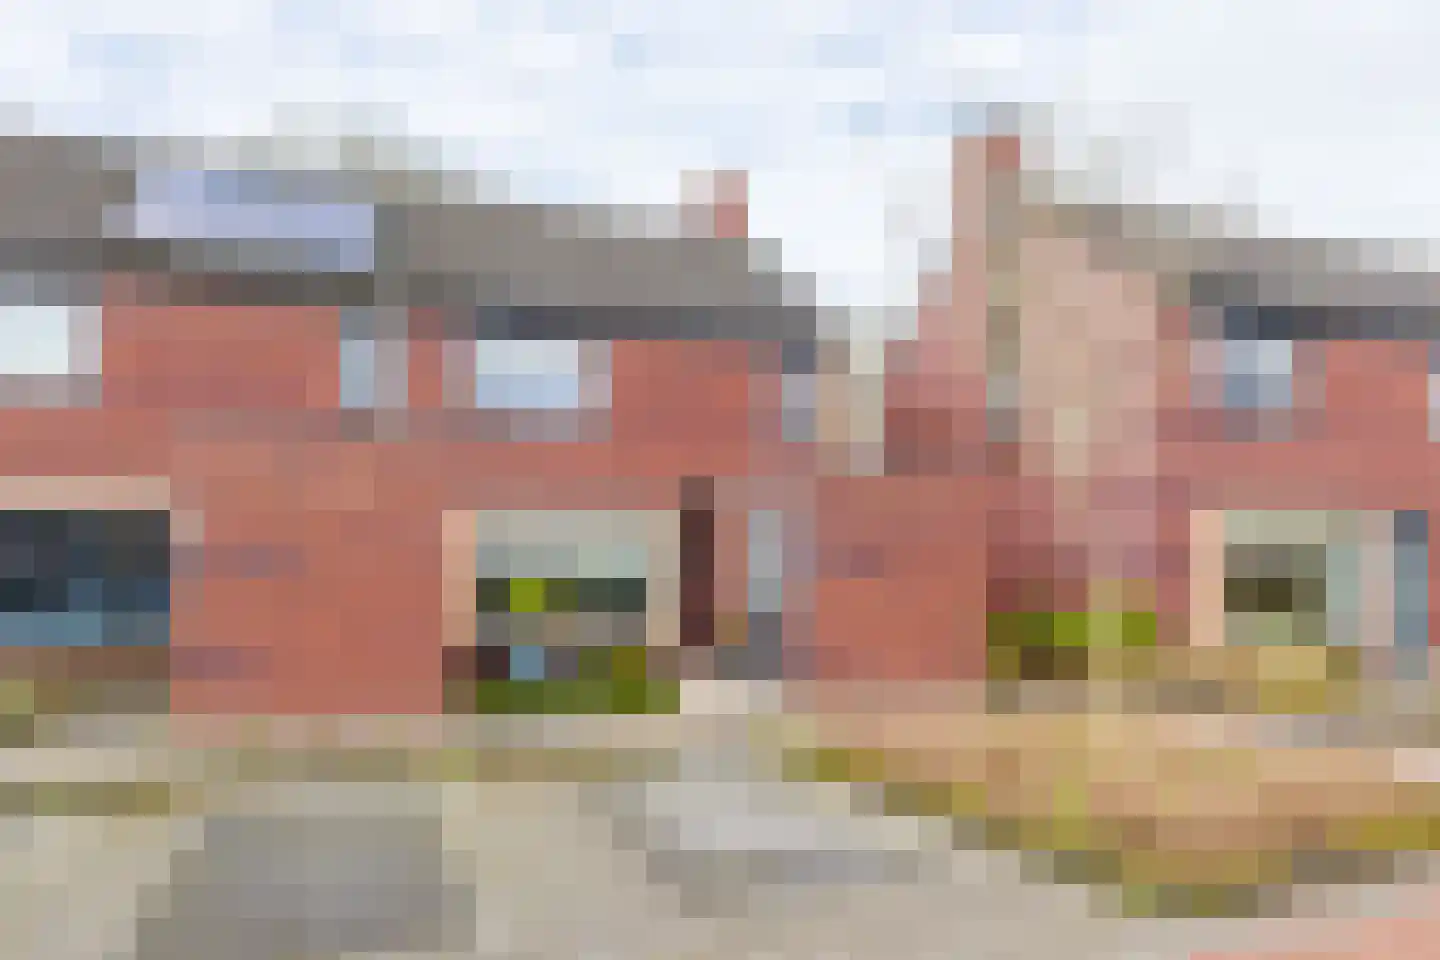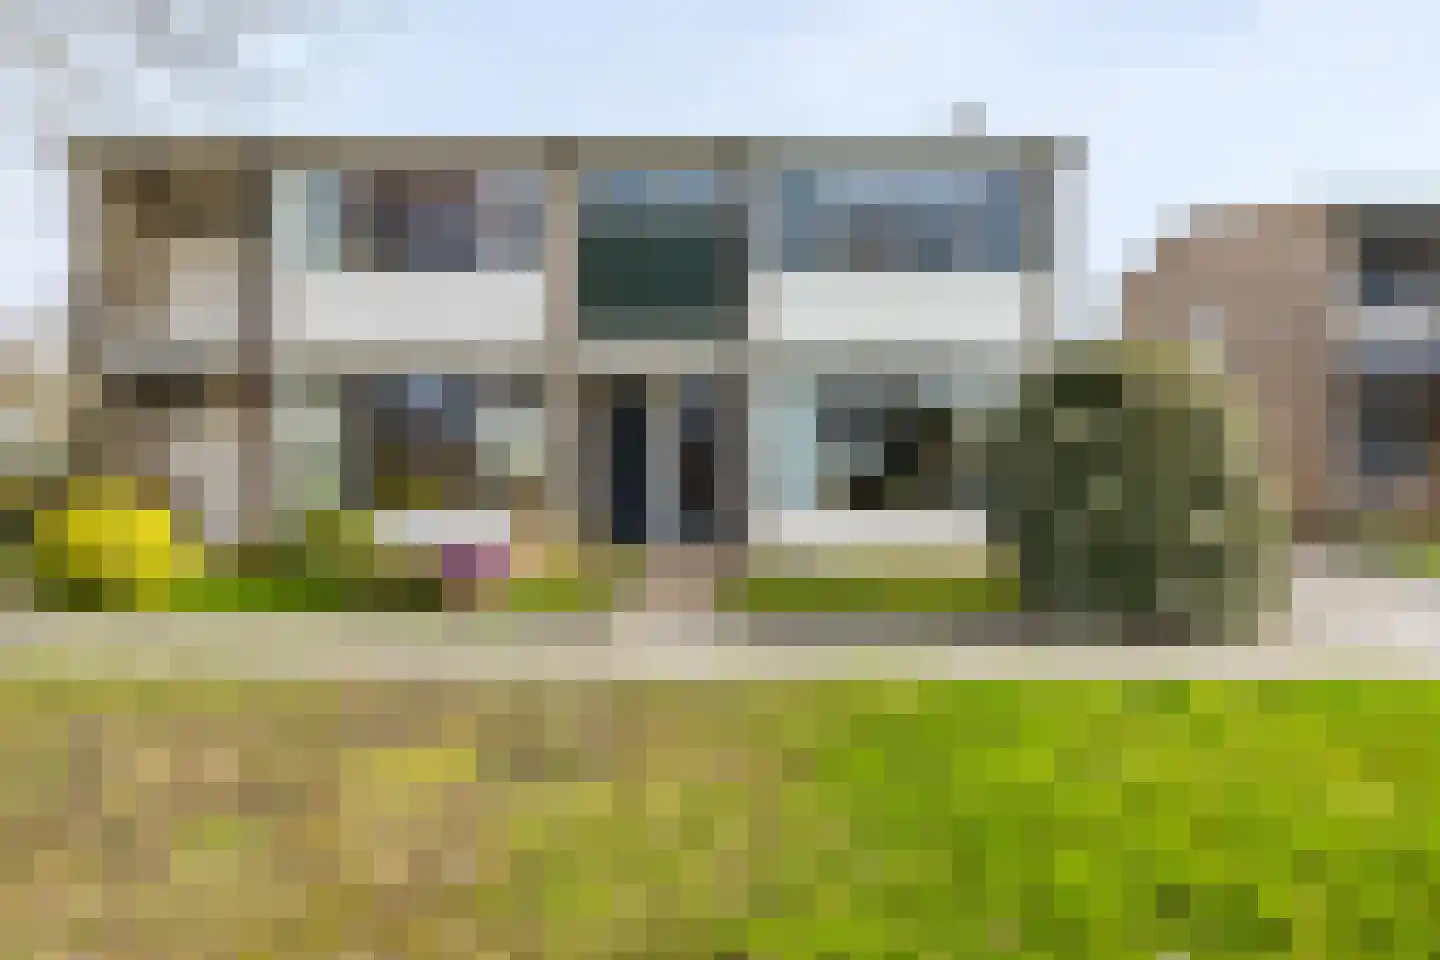
- Sold
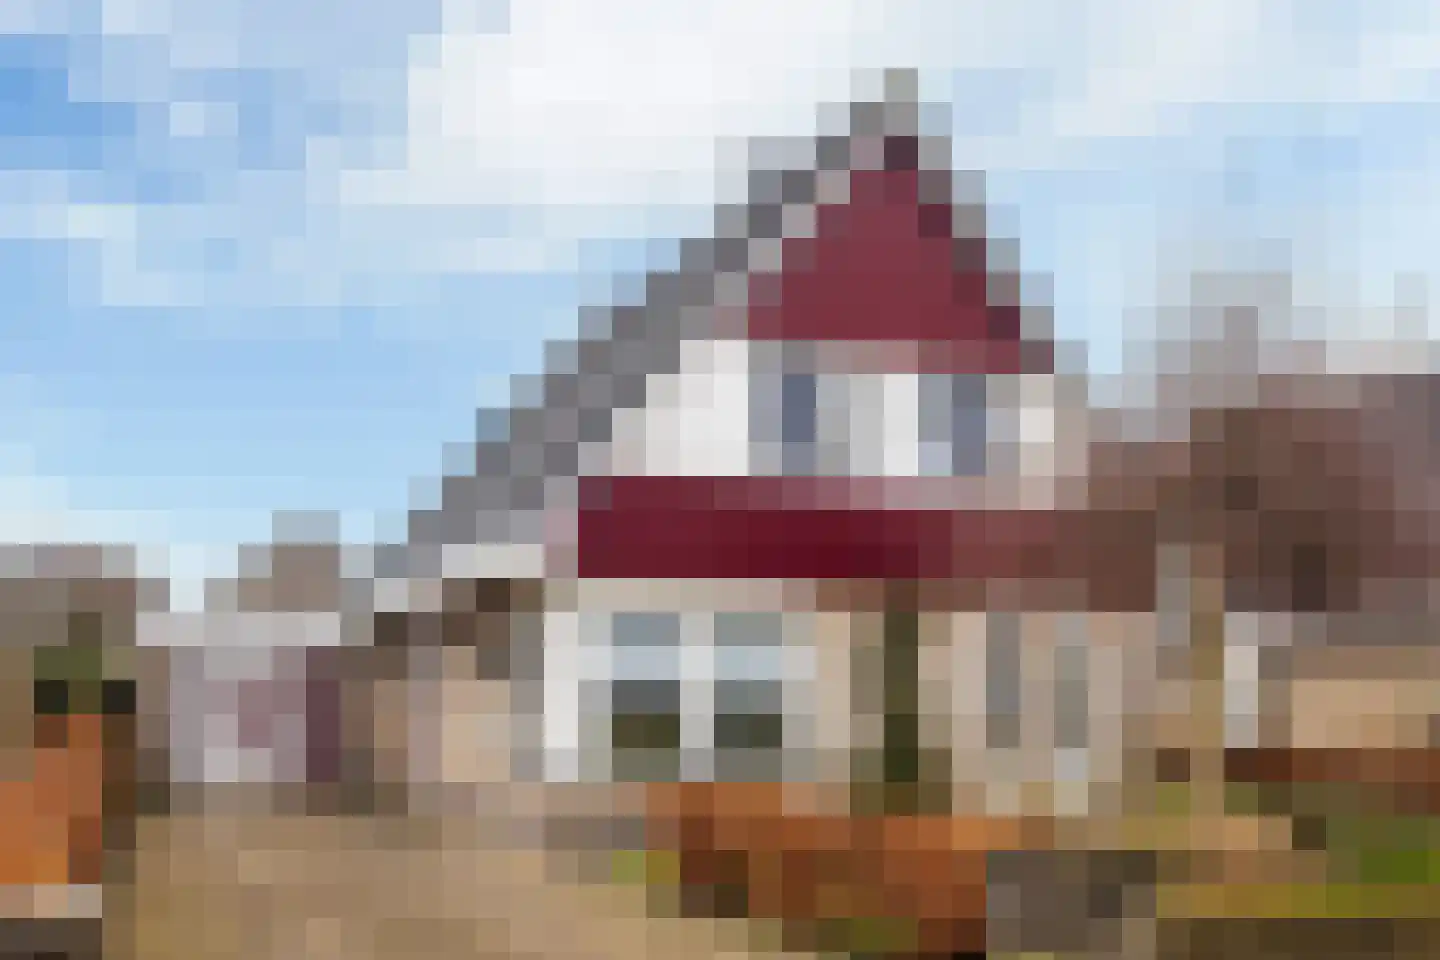
Jan Eisengastrjitte 52
8401EA Gorredijk
€ 275.000 k.k.
€ 3.667/m²
C
Save as favorite
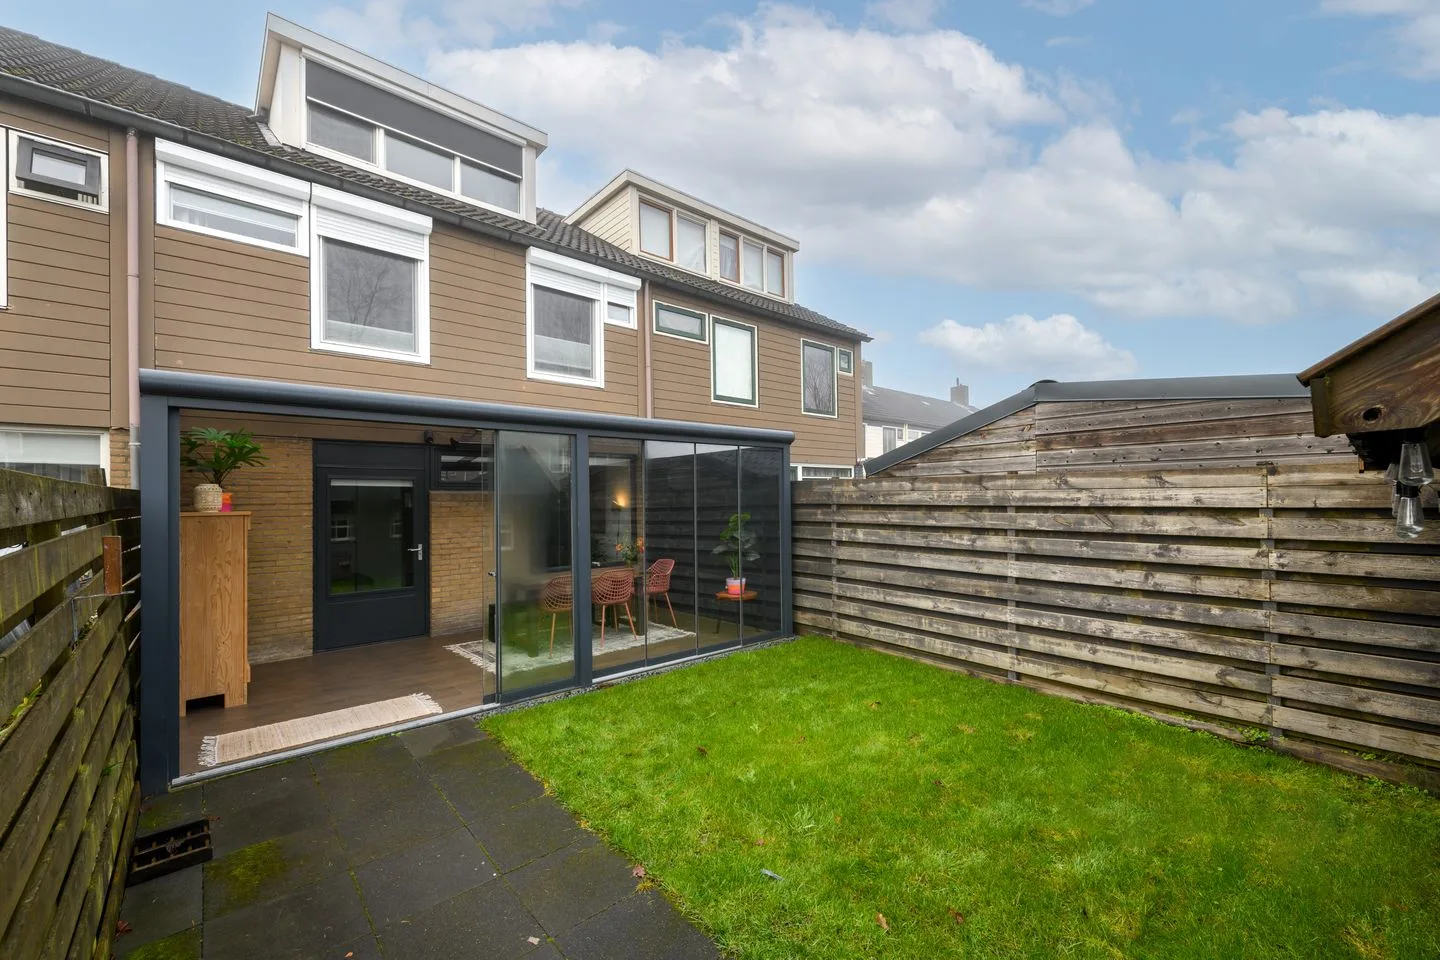
- Living area
- 75 m²
- Land area
- 303 m²
- Bedrooms
- 3