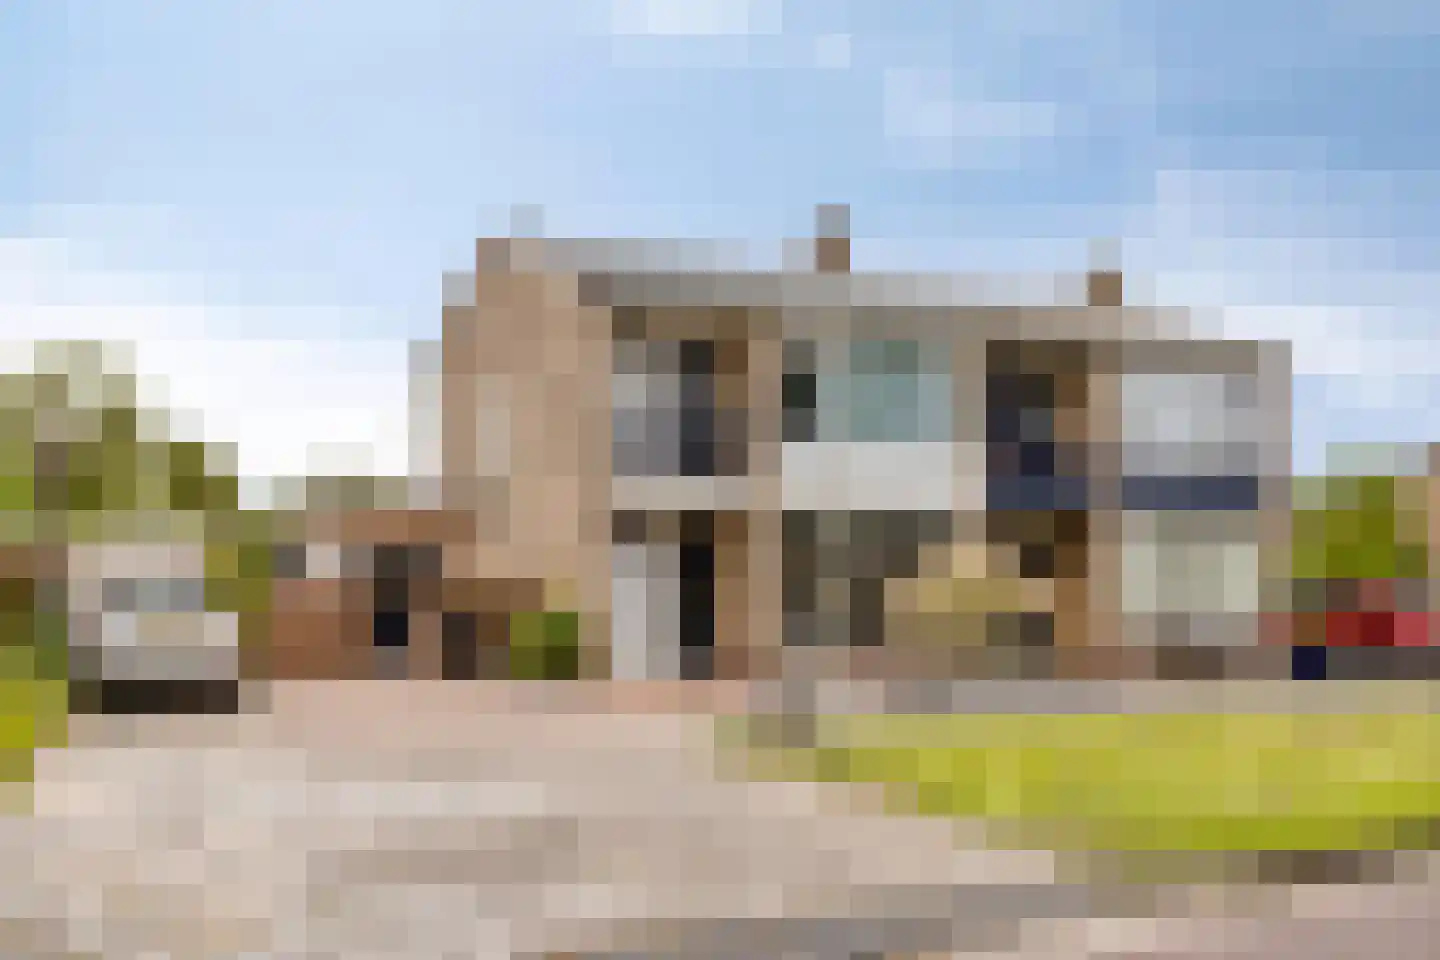
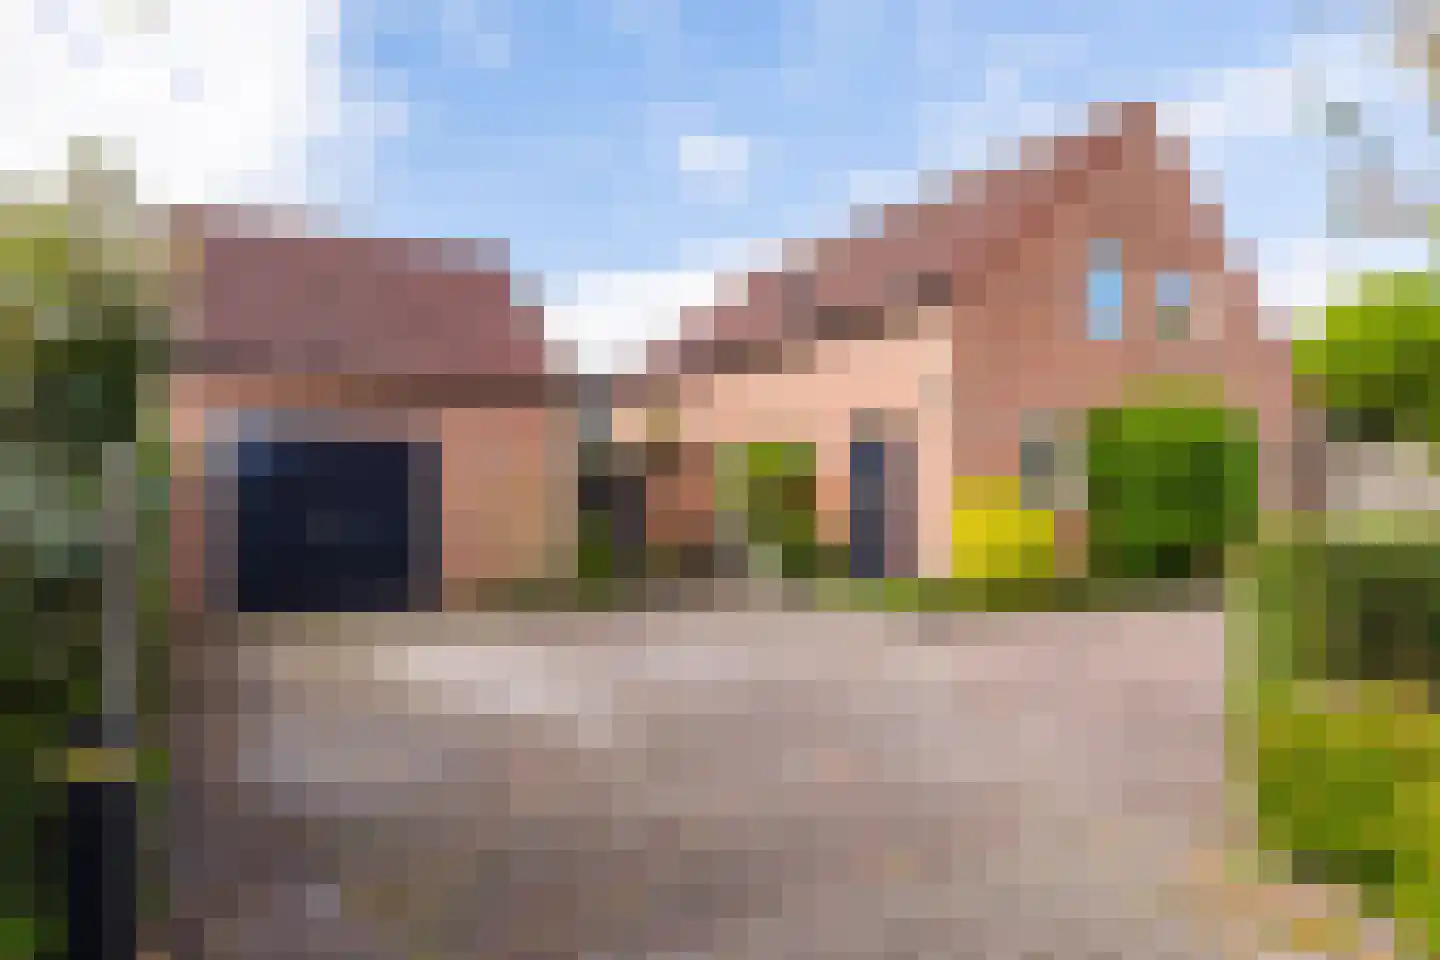
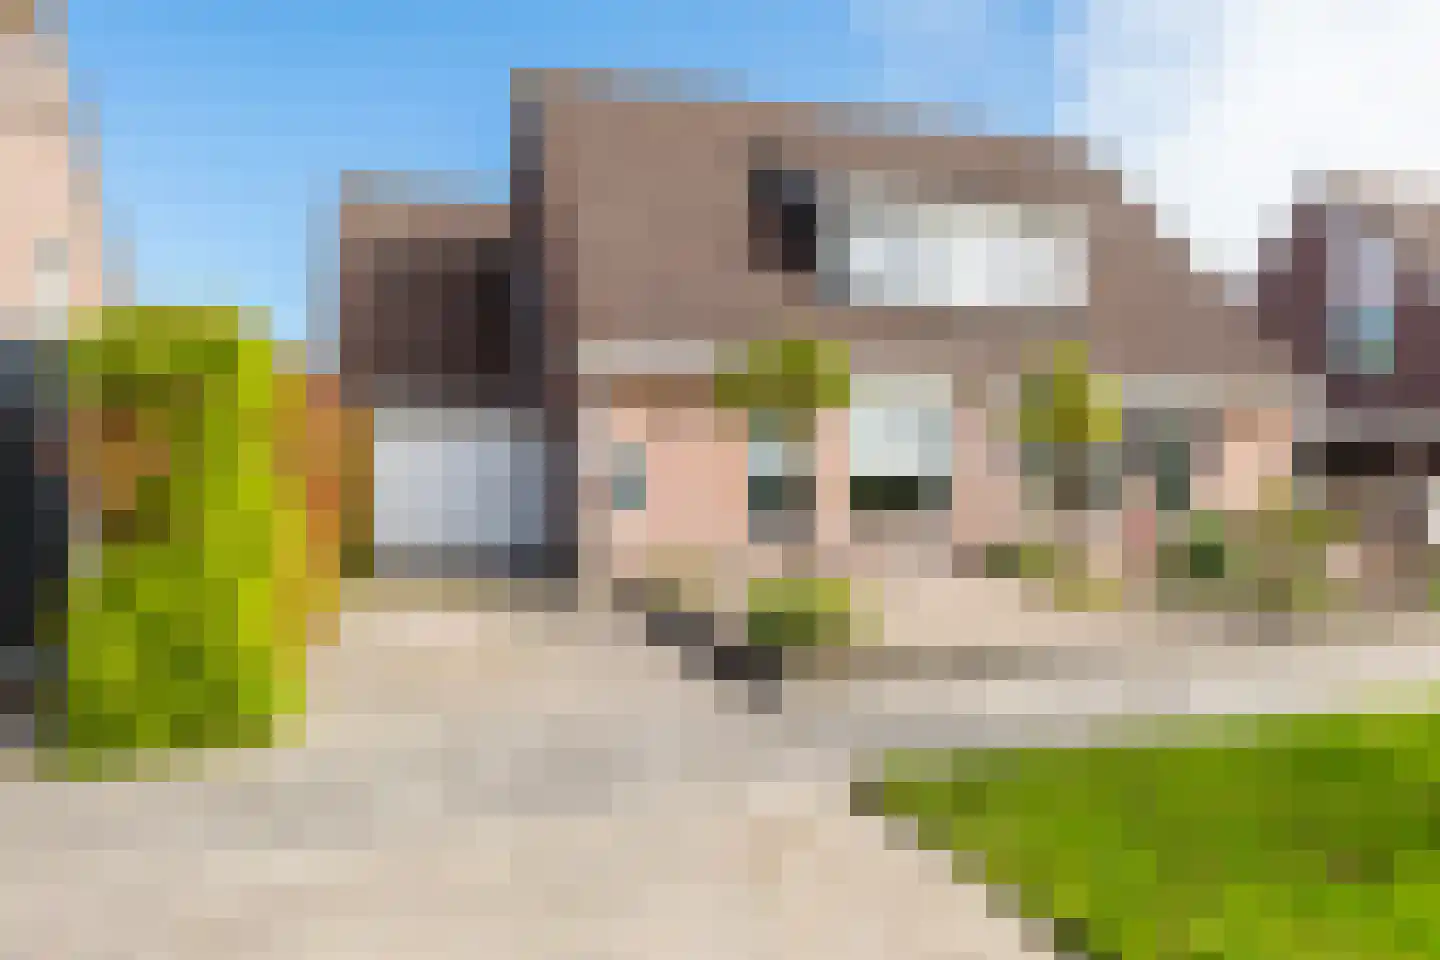
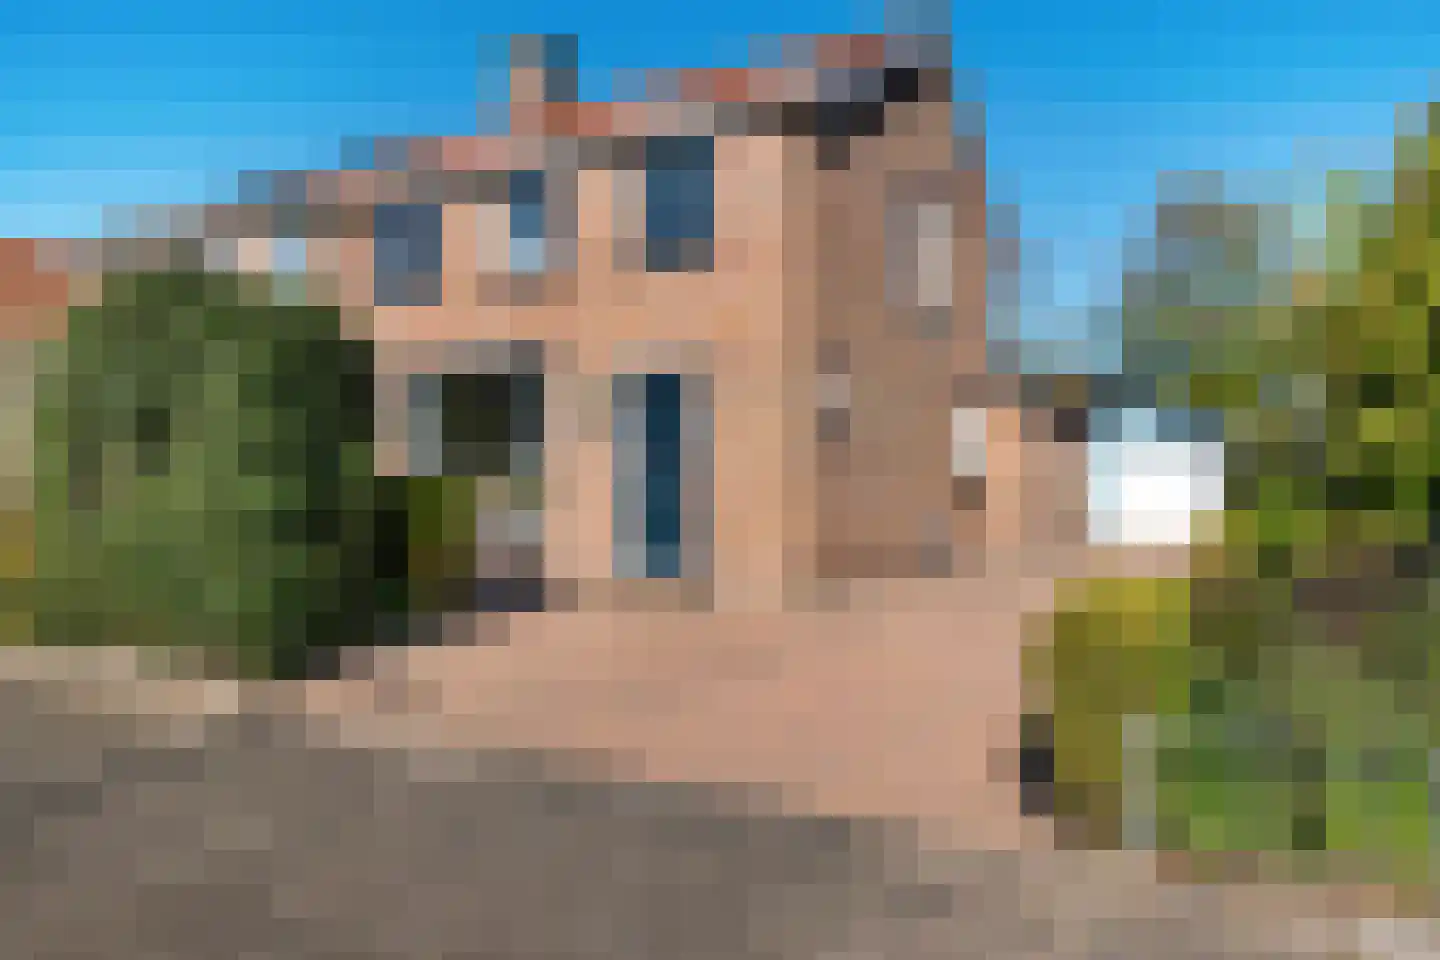
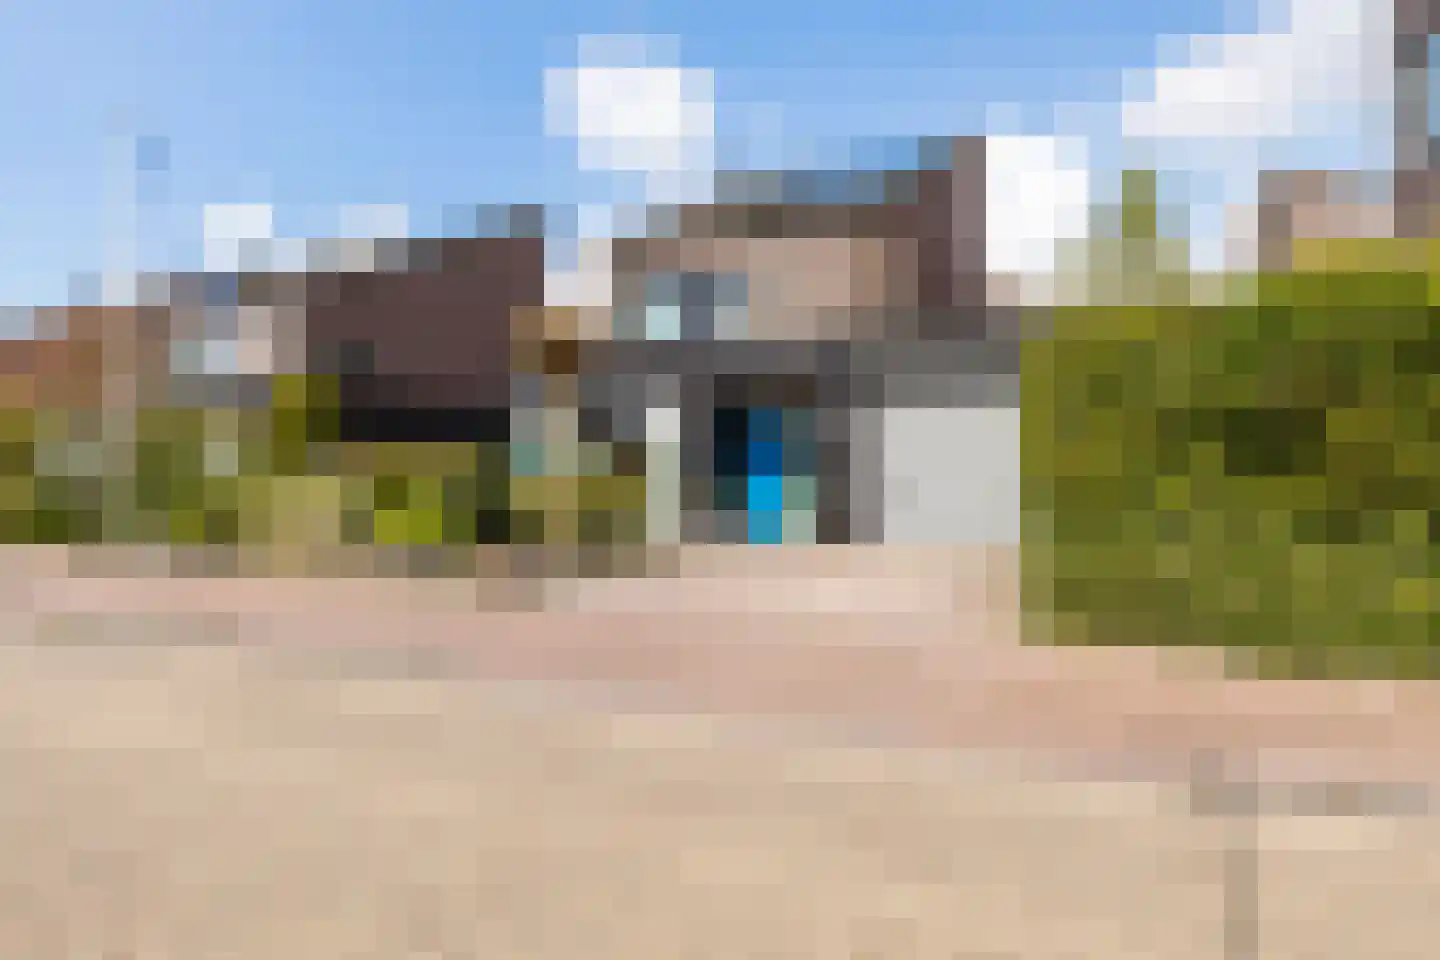
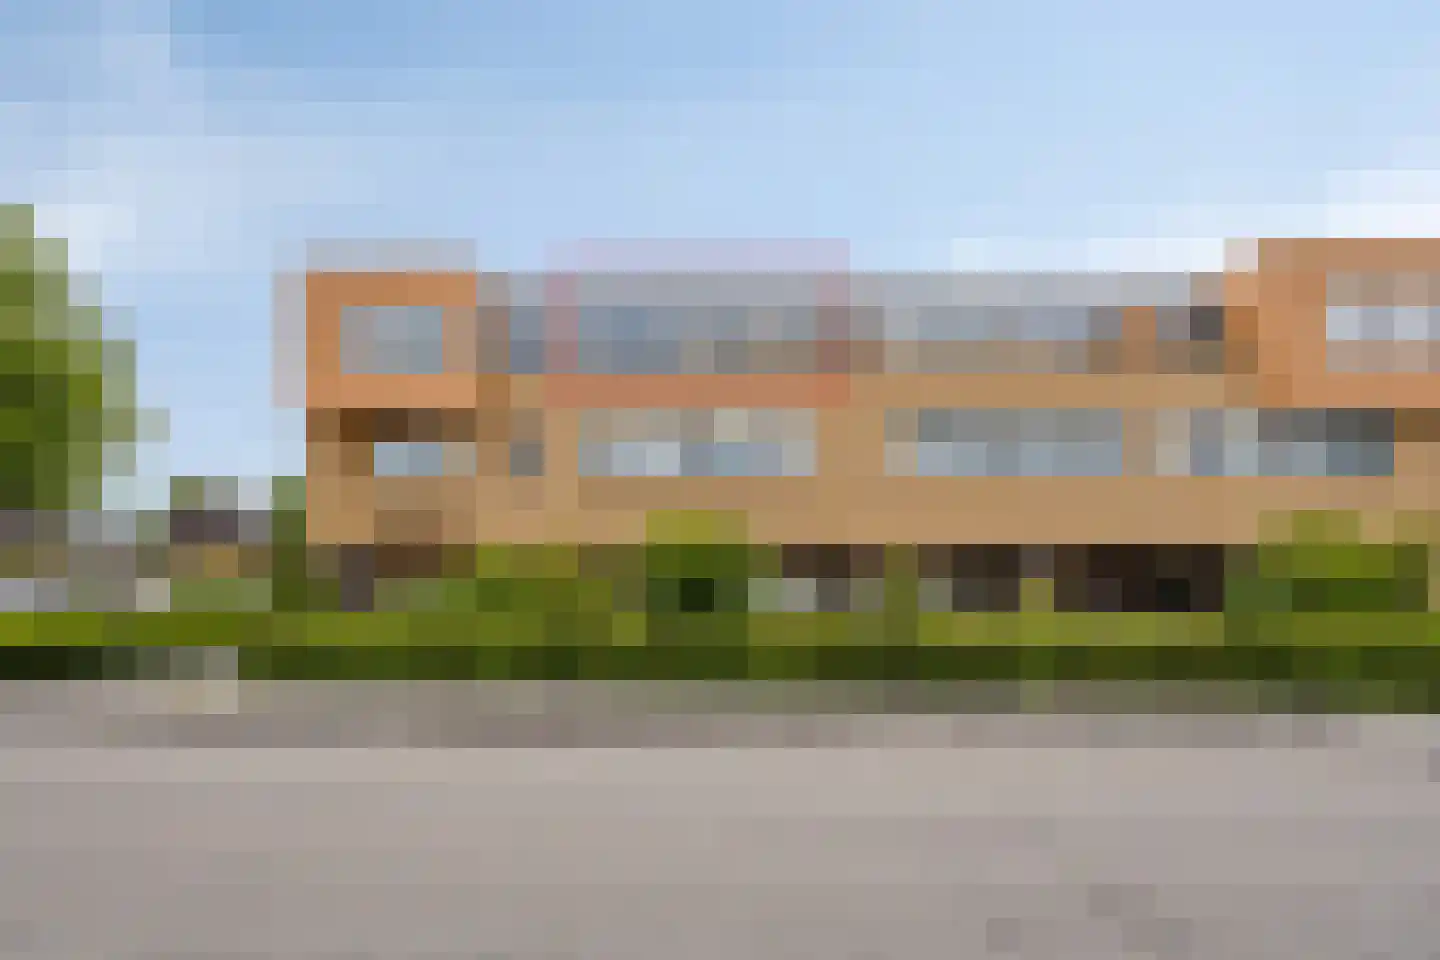
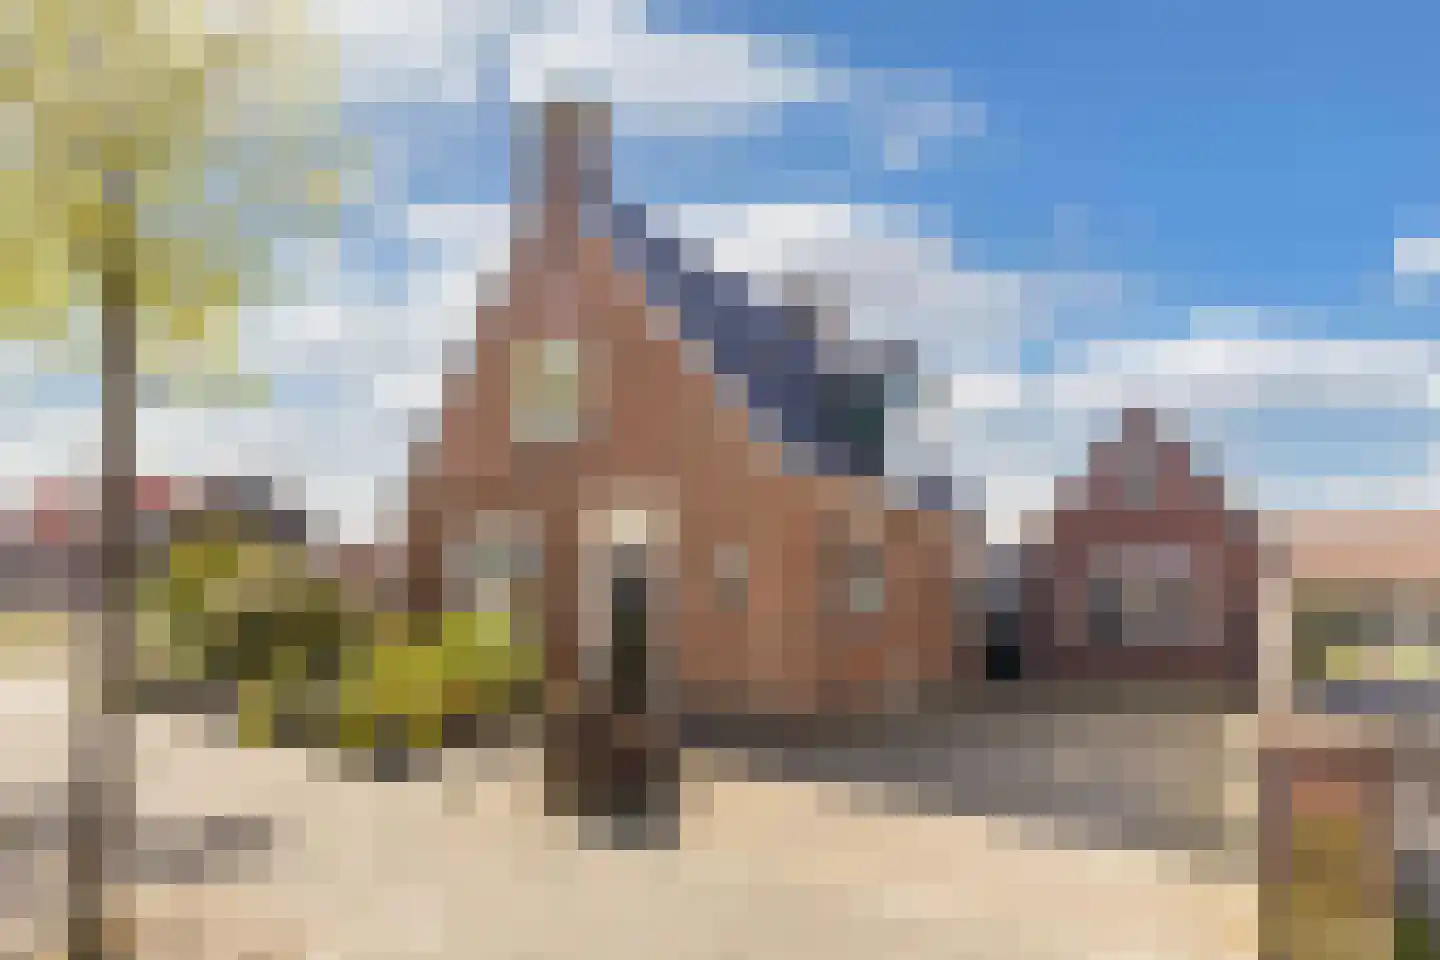
- Available
De Leijen 39
8401AX Gorredijk
€ 2.195.000 k.k.
€ 4.452/m²
- Living area
- 493 m²
- Land area
- 22100 m²
- Bedrooms
- 5
Searching in 115 houses in Gorredijk
Type to search. Use arrow down and arrow up to navigate through results and press Enter to open.
Hidden search suggestions.
View current properties in Gorredijk or search targeted on street, postal code and property characteristics.
View the current housing stock in Gorredijk and quickly filter by price, living area, rooms and more. There are currently 115 houses in this place within our selection. View also 81 sold houses in Gorredijk for extra insight into the local housing market.
8401AX Gorredijk
€ 2.195.000 k.k.
€ 4.452/m²
8401RP Gorredijk
€ 359.000 k.k.
€ 3.294/m²
8401TT Gorredijk
€ 524.500 k.k.
€ 4.163/m²
8401MN Gorredijk
€ 639.500 k.k.
€ 3.634/m²
8401AB Gorredijk
€ 439.500 k.k.
€ 3.959/m²
8401DK Gorredijk
€ 389.500 k.k.
€ 3.219/m²
8401MK Gorredijk
€ 695.000 k.k.
€ 3.390/m²
8401XM Gorredijk
€ 495.000 k.k.
€ 3.561/m²
8401XL Gorredijk
€ 349.500 k.k.
8401BN Gorredijk
€ 359.000 k.k.
8401BW Gorredijk
€ 169.500 k.k.
8401MN Gorredijk
€ 600.000 k.k.
€ 3.448/m²
8401DK Gorredijk
€ 485.000 k.k.
€ 2.425/m²
8401PA Gorredijk
€ 325.000 k.k.
€ 3.736/m²
8401PX Gorredijk
€ 415.000 k.k.
€ 3.952/m²
8401PS Gorredijk
€ 300.000 k.k.
€ 2.459/m²
8401DE Gorredijk
€ 375.000 k.k.
€ 1.803/m²
8401CZ Gorredijk
€ 275.000 k.k.
€ 2.989/m²
8401BX Gorredijk
€ 650.000 k.k.
€ 2.876/m²
8401BW Gorredijk
€ 299.500 k.k.
€ 2.286/m²
8401PA Gorredijk
€ 319.000 k.k.
€ 3.890/m²
8401EJ Gorredijk
€ 335.000 k.k.
€ 2.107/m²
8401EC Gorredijk
€ 395.000 k.k.
€ 2.669/m²
8401AK Gorredijk
€ 399.500 k.k.
€ 4.296/m²
8401CW Gorredijk
€ 375.000 k.k.
€ 3.378/m²
8401RM Gorredijk
€ 250.000 k.k.
8401CH Gorredijk
€ 185.000 k.k.
8401XG Gorredijk
€ 375.000 k.k.
Get free quotes from real estate agents with local market knowledge. Compare more than 29 real estate agents in Gorredijk.
Selling a home in Gorredijk? View the sales-oriented guide sell a house in Gorredijk, compare all real estate agents in Gorredijk or view the top 10 real estate agents in Gorredijk for extra context to your choice.
Real estate agents make sharper offers when they know you're comparing — ask for quotes for sale or purchase.
Practical answers about housing supply, sales and comparing real estate agents in Gorredijk.
The costs of a real estate agent in Gorredijk depend on commission, setup costs, property presentation and the chosen service. Compare the 29 real estate agents in Gorredijk via the real estate agent page and request multiple quotes to compare rates and approach well.
Within our selection, we are currently showing 115 houses in Gorredijk. View also the sold houses in Gorredijk to compare the current offering with recent transactions.
Take into account not only price and living area but also maintenance, energy label, location, outdoor space and sales status. This way you compare houses in Gorredijk on more than just the asking price.
A local real estate agent knows the neighborhoods, recent transactions and demand in Gorredijk. By comparing 29 real estate agents in the region you get a better insight into prices, sales strategy and expected yield; the top 10 in Gorredijk provides a useful starting point.
Yes, when making a sales plan, a valuation in Gorredijk is wise. You gain insight into a realistic asking price and can then compare offers from real estate agents specifically.
View current location data on residents, WOZ development, housing stock, energy consumption, business activity and safety in Gorredijk. In 2026 were there 7.544 residents. The average WOZ value in 2025 is EUR 292.000.
These figures help to better assess and compare the housing stock in Gorredijk with recent sold homes. Orient yourself then on suitable top real estate agents in Gorredijk for sales advice in this region.
Residents
7.544
Last year: 2026
Average WOZ
EUR 292.000
Last year: 2025
Average income per person.
EUR 29.900
Source: AllNumbers
Crimes (current year)
133
Total registered
| Year | Residents |
|---|---|
| 2021 | 7.415 |
| 2022 | 7.325 |
| 2023 | 7.430 |
| 2024 | 7.525 |
| 2025 | 7.480 |
| 2026 | 7.544 |
| Year | Average WOZ |
|---|---|
| 2021 | EUR 216.000 |
| 2022 | EUR 238.000 |
| 2023 | EUR 277.000 |
| 2024 | EUR 285.000 |
| 2025 | EUR 292.000 |
Hoger
1.450
Praktisch
1.460
Middelbaar
2.440
Europa
360
Nederland
6.600
Buiten Europa
520
Label A
1.120
Label C
839
Label B
587
Label D
346
Label G
332
Label F
171
Label E
116
Label A+++
112
Label A++++
81
Label A+
41
Label A++
25
Label A+++++
2
| Year | Gas (m3) | Electricity (kWh) |
|---|---|---|
| 2020 | 1.300 | 2.660 |
| 2021 | 1.380 | 2.740 |
| 2022 | 1.080 | 2.560 |
| 2023 | 910 | 2.460 |
| 2024 | 860 | 2.560 |
Hoekwoning
Gas: 860 • Electricity: 2.440
Huurwoning
Gas: 690 • Electricity: 2.070
Koopwoning
Gas: 1.050 • Electricity: 2.710
Appartement
Gas: 600 • Electricity: 1.650
Tussenwoning
Gas: 810 • Electricity: 2.220
Vrijstaande woning
Gas: 1.210 • Electricity: 3.250
Twee-onder-één-kap woning
Gas: 940 • Electricity: 2.460
Total number of company establishments: 925
| Period | Crimes |
|---|---|
| jan 2026 | 10 |
| jul 2025 | 16 |
| jun 2025 | 8 |
| mei 2025 | 11 |
| mrt 2025 | 17 |
| mrt 2026 | 3 |
| nov 2024 | 10 |
| nov 2025 | 9 |
| okt 2024 | 15 |
| okt 2025 | 16 |
| sep 2024 | 6 |
| sep 2025 | 8 |
These figures give an indicative picture of safety trends in the living environment of Gorredijk.
Short answers based on current local statistics, handy for a quick comparison of the living environment.
Gorredijk telt in 2026 ongeveer 7.544 inwoners.
De gemiddelde WOZ-waarde in Gorredijk is in 2025 circa € 292.000.
Het gemiddelde inkomen per inwoner in Gorredijk ligt rond € 29.900 per jaar.
Voor het huidige jaar gaat het om ongeveer 133 geregistreerde misdrijven. Gebruik deze cijfers als indicatie en vergelijk trends per periode.
In Gorredijk komt vooral "Vrijstaande woningen" veel voor, met ongeveer 989 woningen.