
Renken Makelaardij b.v. is a real estate agency based in Wedde, with expertise in the field of agricultural real estate and rural properties. In a region where nature and landscape are central, Renken Makelaardij b.v. offers a personal and detailed approach for buyers and sellers looking for reliable partners in the market of agricultural and rural real estate. With a strong focus on quality, transparency and customer orientation, Renke...
Current housing stock
-
- Available
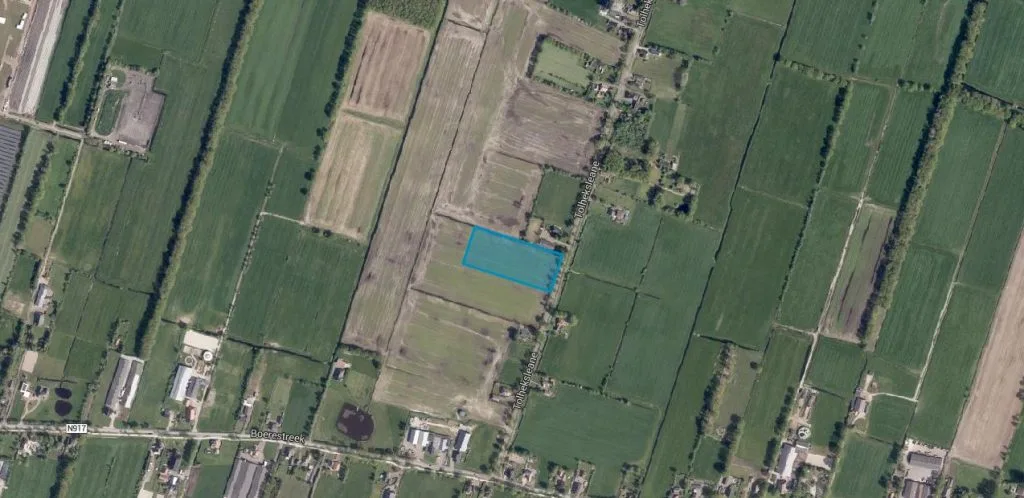
Paterslaan 59 a
9515PM Gasselternijveenschemond
€ 640.000 k.k.
€ 5.333/m²
Save as favorite- Living area
- 120 m²
- Land area
- 10435 m²
- Bedrooms
- 3
Reviews (1)
Review platforms
BronscoresTotal score
1 total reviews

1 reviews on Google
-
Johanna für friede und freiheit
8Translated by AIGood company, enough choice, good service, helpful. Neat and fast, even received flowers when it took a little longer.