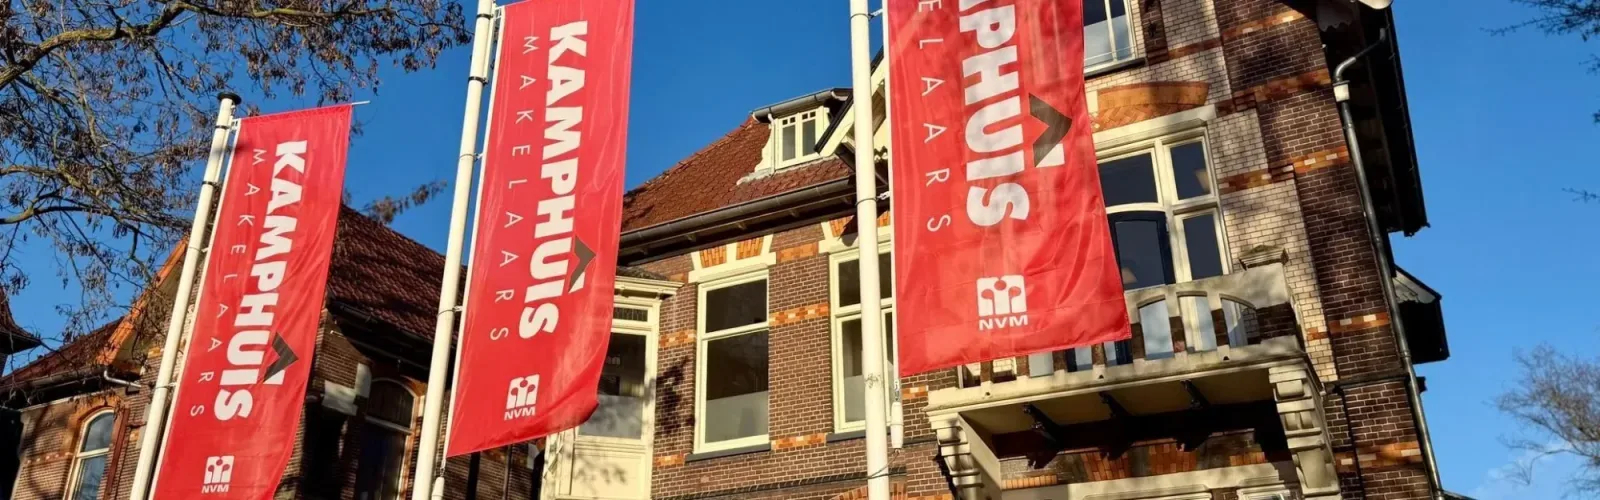

Als best verkopende makelaar in Almelo (bron NVM/FUNDA) staan wij voorop met verkoopcijfers die spreken voor zich. Onze actieve aanwezigheid op social media, met bijna 7000 volgers op Facebook, laat zien hoe belangrijk we vinden om in contact te blijven met de markt. Via live video’s op Facebook bieden wij een unieke manier om woningen te bezichtigen, zodat klanten direct een indruk kunnen krijgen van de ruimtes. Onze verkoopstrategie i...
Current housing stock
-
- Available
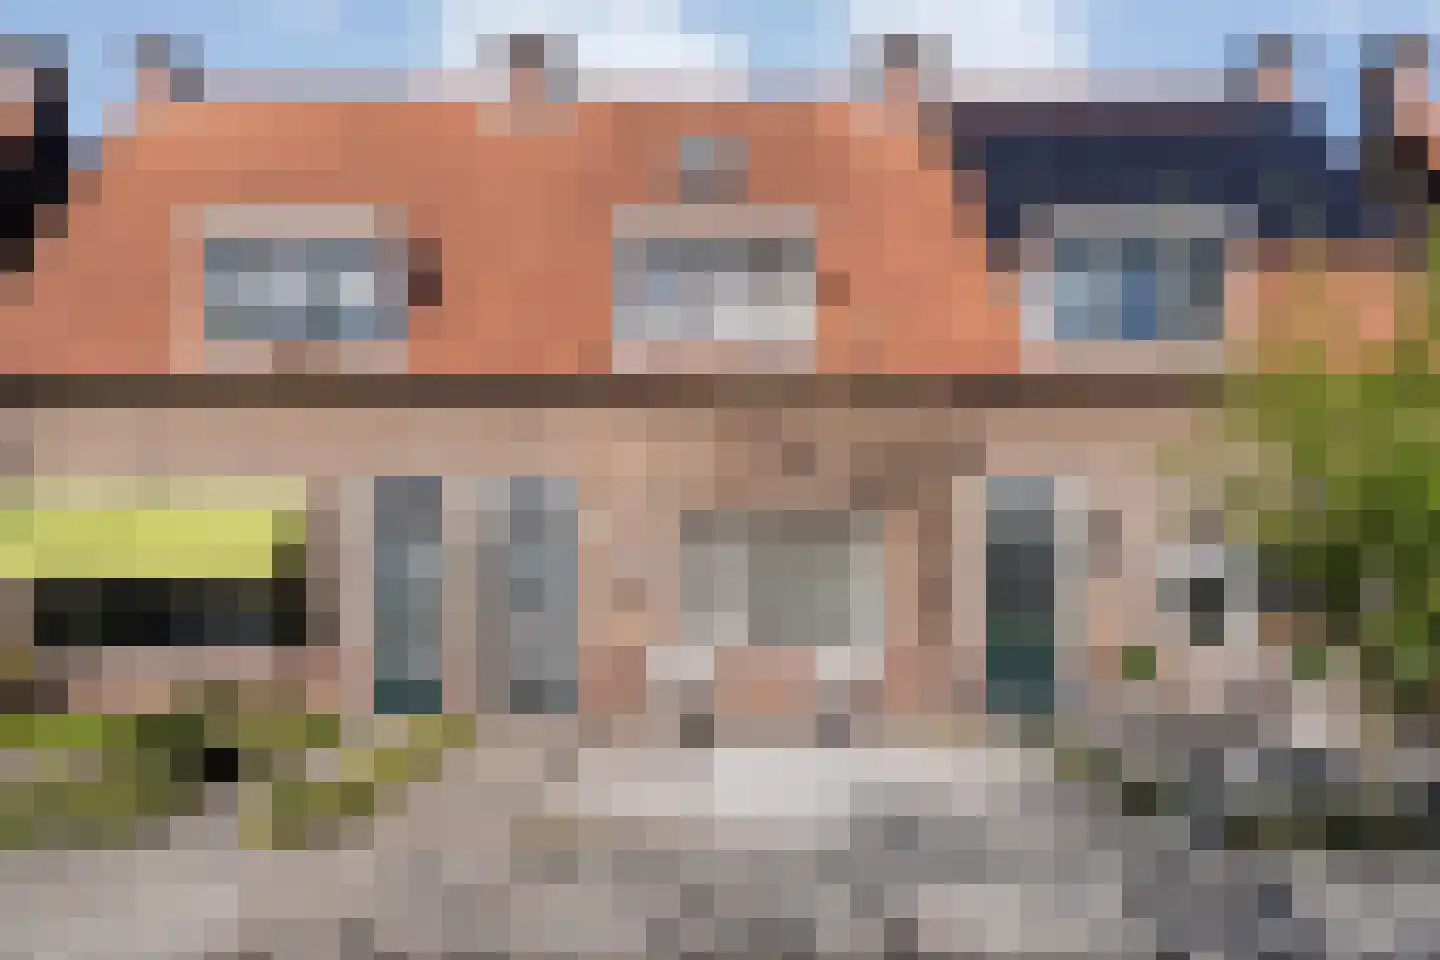
De Pauw 11
7609TR Almelo
€ 398.000 k.k.
ASave as favorite- Living area
- 114 m²
- Land area
- 203 m²
- Bedrooms
- 2
-

- Available
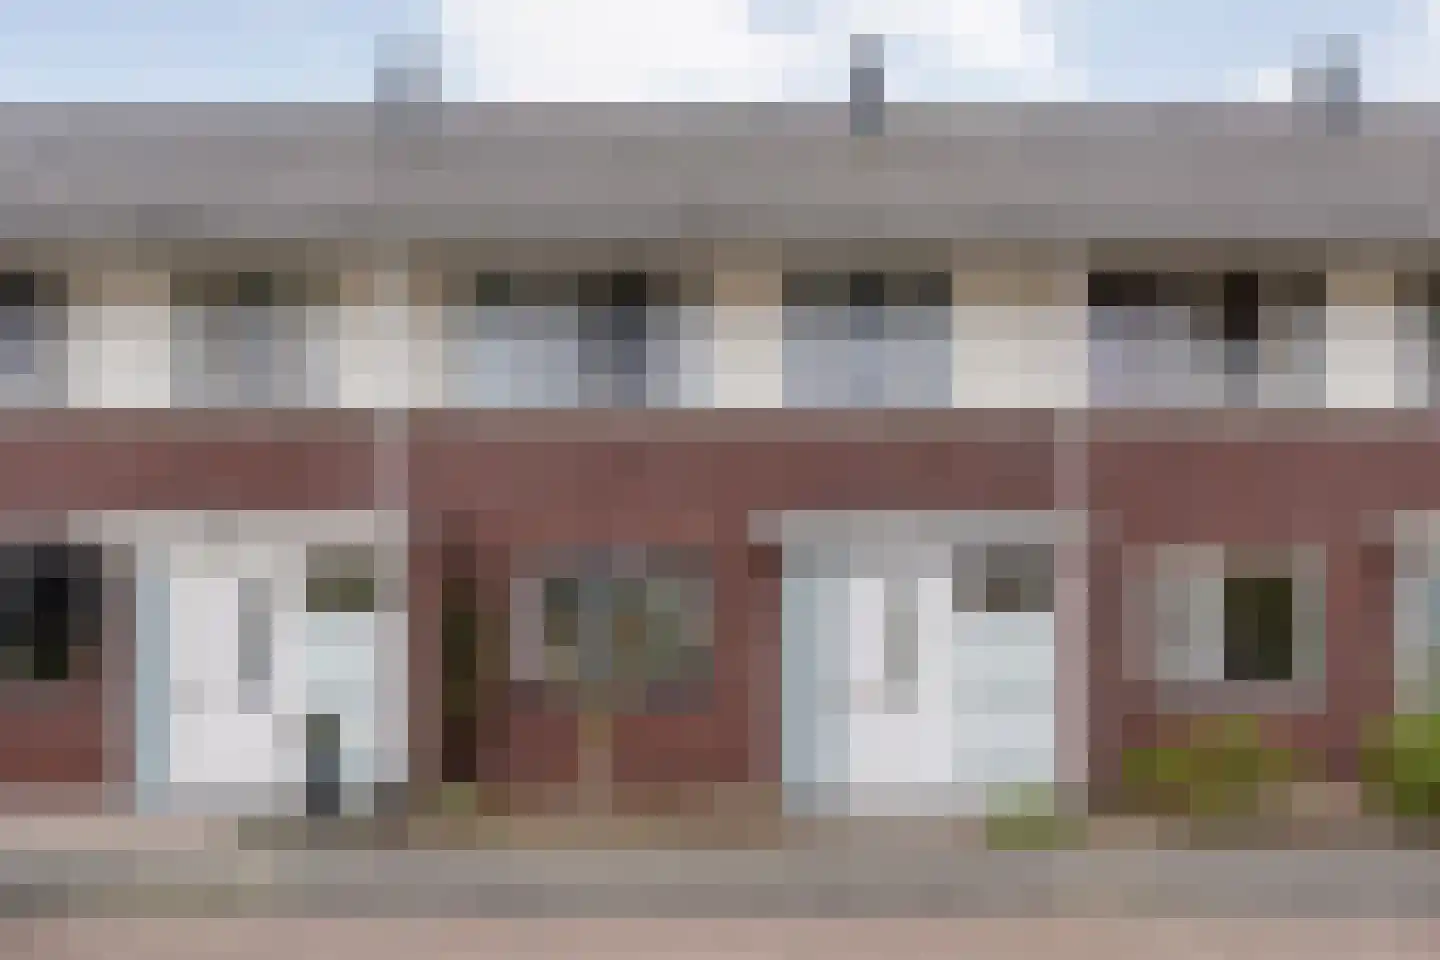
De Jager 2
7609JS Almelo
€ 649.000 k.k.
CSave as favorite- Living area
- 145 m²
- Land area
- 733 m²
- Bedrooms
- 3
-

- Available
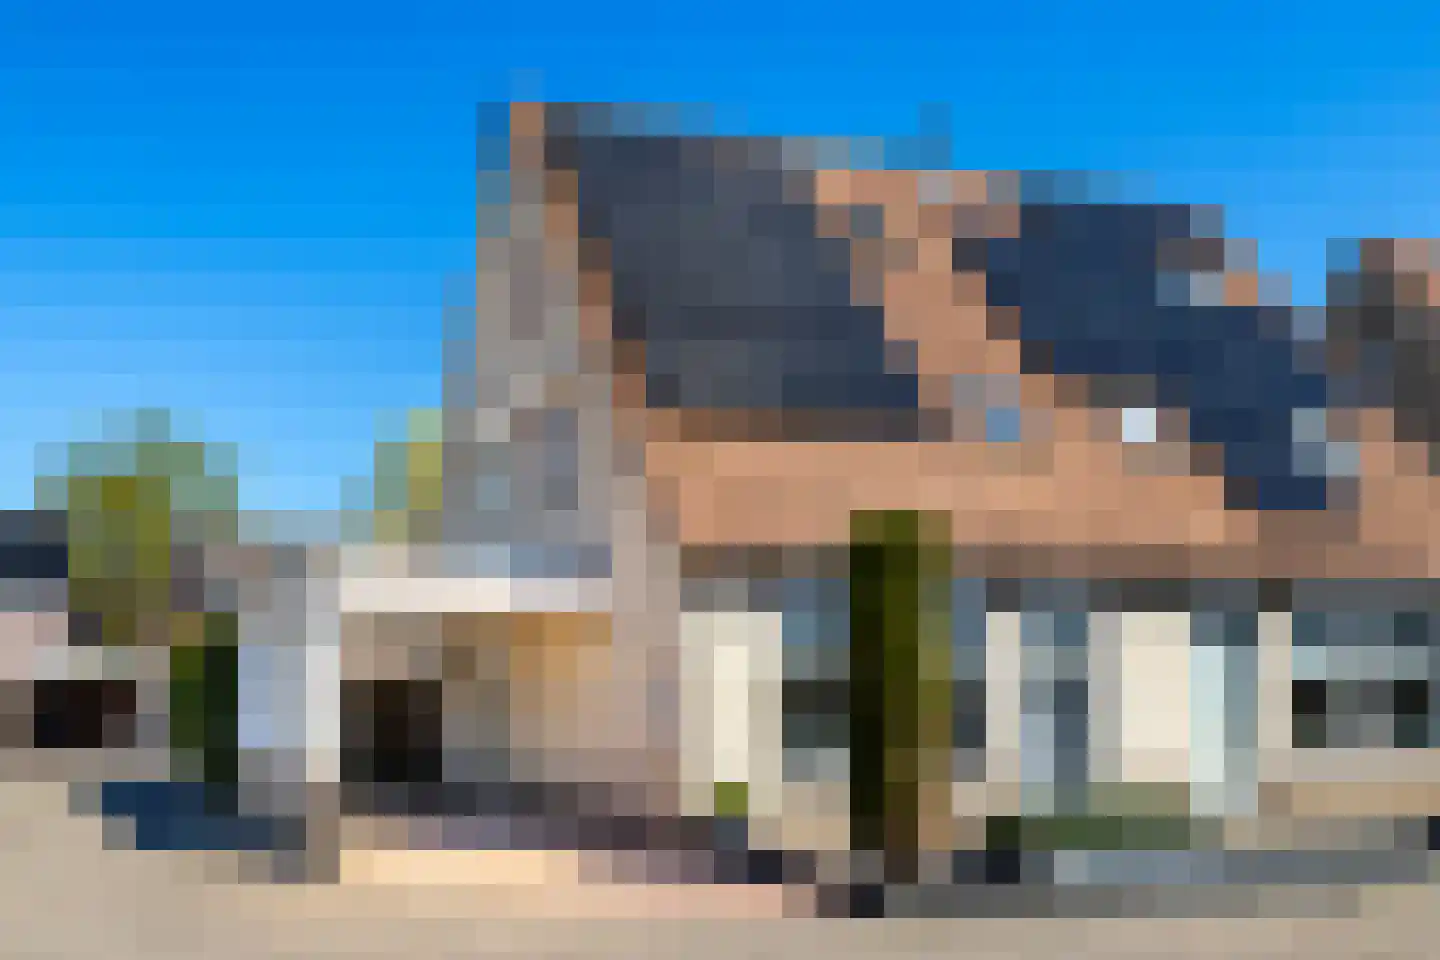
Kingmastate 18
7608HE Almelo
€ 299.000 k.k.
ASave as favorite- Living area
- 136 m²
- Land area
- 152 m²
- Bedrooms
- 4
-
- Available
Deldensestraat 6
7601RS Almelo
€ 189.000 k.k.
GSave as favorite- Living area
- 85 m²
- Land area
- 124 m²
- Bedrooms
- 3
-

- Available
Reggestraat 2
7607LM Almelo
€ 469.000 k.k.
CSave as favorite- Living area
- 112 m²
- Land area
- 232 m²
- Bedrooms
- 4
-

- Available
Olmstraat 26
7605CL Almelo
€ 229.000 k.k.
€ 1.862/m²
ESave as favorite- Living area
- 123 m²
- Land area
- 237 m²
- Bedrooms
- 3
Reviews (134)
Review platforms
BronscoresTotal score
134 total reviews

Funda
97 reviews on Funda

37 reviews on Google
-
Laan van Indië 24
9Uitermate tevreden over het verkoopproces. Goede communicatie, goed inzicht in mogelijkheden en kansen.
-
Saffierstraat 10
10Erg goed, snel en zeer vriendelijk begeleid met de verkoop van ons huis! Na een goed gesprek werd alles snel in gang gezet.
-
Heslingahuis 17
10Het persoonlijke contact en de begeleiding maakte dat er geen stress was tijdens de verkoop van het huis.
-
De Beo 57
9Goed contact, zeer kundig en heeft alles uit de kast moeten halen om de verkoop over de streep te halen.
-
Werfstraat 1 15
10Zeer goed begeleid door Thijs bij de verkoop van t appartement, waarbij hij ten alle tijde klaar staat voor uitleg
-
Plateau 10
10Translated by AIThe contact went smoothly, expert and good understanding of the current market. So we are satisfied with this real estate agent.
-
Borg Piloursema 5
10Kontakt met de makelaar was uitstekend. We waren zeer tevreden met alles. Door Kamphuis makelaars hebben wij een fantastisch appartement gevonden .
-
Jan Tooropstraat 11
9Met Thijs duidelijke verwachtingen besproken voordat het huis in de verkoop ging. Het plannen van de bezichtigingen ging gemakkelijk en de verkoop is snel afgerond. Wij zijn tevreden!
-
Laan van Indië 55
10Het contact met Thijs verliep super. Er werd goed meegedacht, er werd snel gereageerd op vragen en we werden goed meegenomen in het proces. We hebben ons huis voor een mooie prijs kunnen verkopen. Aanrader!
-
Sweelincklaan 33
10Wij zijn super blij met de snelle verkoop van onze woning!! Binnen een week was ons huis verkocht!! Wij zijn super goed begeleid door Thijs. Super goeie communicatie!!
-
De Havik 47
10Communicatie verliep heel fijn en konden altijd terecht met onze vragen. Het gehele proces verliep vrijwel stressvrij en dat was heel fijn. Sander is een topper!
-
Vixseboxsestraat 49
10Het is allemaal boven verwachting goed gegaan. Alle contacten waren prettig en erg vriendelijk. De begeleiding was uitmuntend. De terugkoppeling was erg prettig en uiteindelijk binnen 2 weken verkocht.
-
Slangemuur 32
8Alles goed verlopen bij de verkoop van onze woning! Moest wel wennen aan de move site, was vroeger wel iets persoonlijker.
-
Havenkade 55
10Alles verliep naar wens , van eerste kennismaking tot de verkoop. Contact met kantoor en de verkregen tussentijdse informatie was ook zeer naar wens.
-
Loowaard 31
10De makelaar heeft ons goed geholpen en goed geadviseerd. Was zeer attent en regeerde zeer snel op al onze vragen. Zijn uitermate tevreden over deze makelaar.
-
De Fazant 97
10Wij zijn in contact gekomen met het kantoor via een project. Vanaf eerste moment goed en fijn gesprek. En verder het traject goed bijgestaan je word door Kamphuis makelaars goed geholpen. En al je spanningen worden ontnomen. Hele fijne en warme makelaarskantoor goed op elkaar ingespeeld. En ze denken en wat ze belooft! Nogmaals willen we heel het team enorm bedanken!🙏🏼🙏🏼
-
Jacob van Ruysdaelstraat 9 b
10Prima markelaar.De makelaar is erg goed. We kunnen hem altijd bereiken, zelfs in het weekend. Vooral Sander heeft ons heel goed geholpen. Hartelijk dank
-
Dekemastate 7
10Translated by AIThijs is very helpful and easy to reach for all questions. The lines are short and the cooperation was extremely pleasant. Absolutely a nice real estate agent to work with.
-
Korianderhof 211
9Translated by AIThe contact went well, short lines. Clear communication. If a problem had arisen I was guided through it well.
-
Iepenstraat 59
10Translated by AIFrom the beginning, I had a very good contact with Mr. Sander. He explained everything clearly, always gave honest and professional advice, and was very patient with all my questions. In addition, he also speaks excellent English. I am very satisfied with the cooperation and can certainly recommend him.