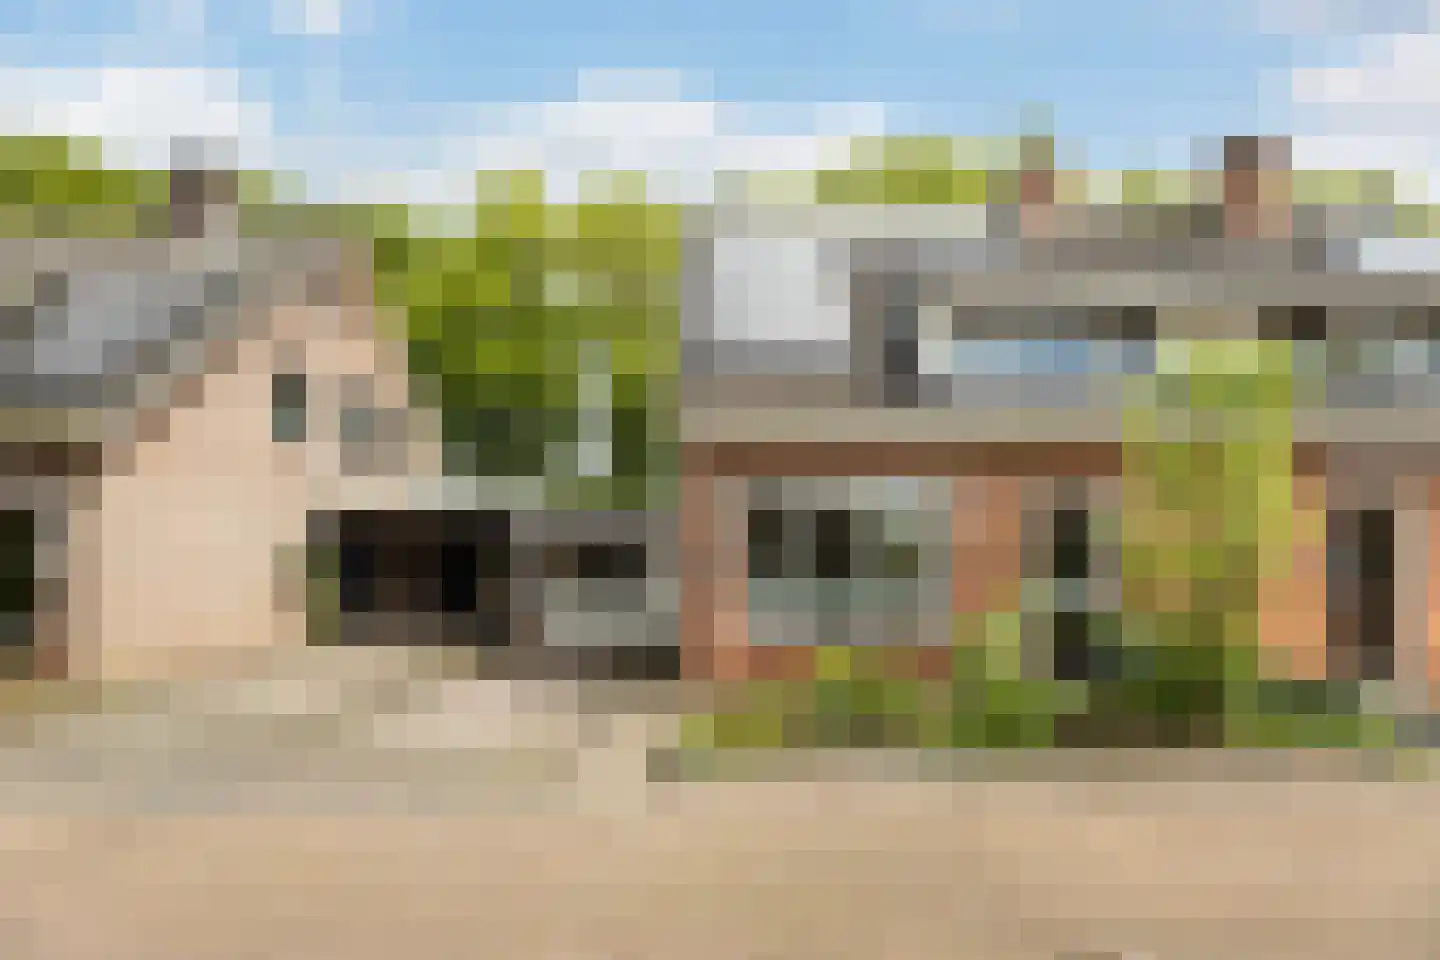
Housing offer in Bornerbroek

Searching in 11 houses in Bornerbroek

Connected to: Vastgoed Nederland NVM Makelaars

View the current housing stock in Bornerbroek and quickly filter by price, living area, rooms and more. There are currently 11 houses in this place within our selection. View also 7 sold houses in Bornerbroek for extra insight into the local housing market.

Selection

Search and filter homes

Set your preferences and discover homes that suit you.

Total supply 244.924
Filters

Set price, area and other characteristics. Adjust a filter or click on Show homes. Location changes directly above.

Reset filters

You search for

  • Place Bornerbroek

Selling a home in Bornerbroek? Compare realtor offers

Get free quotes from real estate agents with local market knowledge. Compare more than 45 real estate agents in Bornerbroek.

Free request a quote

  • Quotes in Bornerbroek
  • Non-binding
  • Personal
  • Compare free rates

Selling a home in Bornerbroek? Compare all real estate agents in Bornerbroek or view the top 10 real estate agents in Bornerbroek for extra context for your choice.

Compare multiple quotes

Real estate agents make sharper offers when they know you're comparing — ask for quotes for sale or purchase.

Frequently asked questions about homes in Bornerbroek

Practical answers about housing supply, sales and comparing real estate agents in Bornerbroek.

Residential and neighborhood statistics in Bornerbroek

View current location data on residents, WOZ development, housing stock, energy consumption, business activity and safety in Bornerbroek. In 2026 were there 2.104 residents. The average WOZ value in 2025 is EUR 483.000.

These figures help to better assess and compare the housing stock in Bornerbroek with recent sold homes. Orient yourself then on suitable top real estate agents in Bornerbroek for sales advice in this region.

Residents

2.104

Last year: 2026

Average WOZ

EUR 483.000

Last year: 2025

Average income per person.

EUR 32.000

Source: AllNumbers

Crimes (current year)

40

Total registered

Demographics and WOZ development

Inhabitants per year

Inhabitants per year in Bornerbroek
Year Residents
2021 1.970
2022 2.025
2023 2.045
2024 2.065
2025 2.095
2026 2.104

Annual WOZ value

WOZ value per year in Bornerbroek
Year Average WOZ
2021 EUR 348.000
2022 EUR 386.000
2023 EUR 449.000
2024 EUR 469.000
2025 EUR 483.000

Composition of residents

Age build-up

65+: 485 0-15: 390 15-25: 250 25-45: 440 45-65: 535

Education level

Hoger

450

Praktisch

340

Middelbaar

750

Origin of residents (2025)

Europa

40

Nederland

2.010

Buiten Europa

50

Housing stock and construction periods

Types of homes

Hoekwoningen 50
Appartementen 196
Tussenwoningen 50
Vrijstaande woningen 426
Twee-onder-één-kap woningen 130

Construction period of buildings

Voor 1700 0
1700 tot 1900 16
1900 tot 1925 26
1925 tot 1950 93
1950 tot 1970 122
1970 tot 1980 82
1980 tot 1990 110
1990 tot 2000 69
2000 tot 2010 85
2010 tot 2020 87
2020 en later 56

Energy and sustainability

Energy label distribution

Label A

178

Label C

128

Label B

118

Label G

83

Label F

68

Label D

59

Label E

22

Label A+++

18

Label A+

7

Label A++++

6

Label A++

5

Label A+++++

0

Average energy consumption per year

Average energy consumption per year in Bornerbroek
Year Gas (m3) Electricity (kWh)
2020 1.650 3.820
2021 1.930 3.960
2022 1.480 3.770
2023 1.190 3.580
2024 1.140 3.800

Consumption per house type

Hoekwoning

Gas: 1.010 • Electricity: 2.980

Huurwoning

Gas: 950 • Electricity: 2.450

Koopwoning

Gas: 1.270 • Electricity: 3.920

Appartement

Gas: 890 • Electricity: 2.610

Tussenwoning

Gas: 990 • Electricity: 2.750

Vrijstaande woning

Gas: 1.390 • Electricity: 4.230

Twee-onder-één-kap woning

Gas: 1.130 • Electricity: 3.370

Business activity in Bornerbroek (2025)

Handel en HORECA 60
Nijverheid en energie 55
Zakelijke dienstverlening 60
Overheid, onderwijs en zorg 40
Landbouw, bosbouw en visserij 60
Vervoer, informatie en communicatie 20
Financiele diensten en onroerendgoed 30
Cultuur, recreatie en overige diensten 30

Total number of company establishments: 355

Recent crime statistics

Recent crime statistics in Bornerbroek
Period Crimes
jan 2026 4
jul 2025 5
jun 2025 6
mei 2025 0
mrt 2025 8
mrt 2026 2
nov 2024 1
nov 2025 2
okt 2024 2
okt 2025 4
sep 2024 2
sep 2025 4

These figures give an indicative picture of safety trends in the living environment of Bornerbroek.

Frequently asked questions about living in Bornerbroek

Short answers based on current local statistics, handy for a quick comparison of the living environment.

Hoeveel inwoners heeft Bornerbroek?

Bornerbroek telt in 2026 ongeveer 2.104 inwoners.

Wat is de gemiddelde WOZ-waarde in Bornerbroek?

De gemiddelde WOZ-waarde in Bornerbroek is in 2025 circa € 483.000.

Wat is het gemiddelde inkomen per inwoner in Bornerbroek?

Het gemiddelde inkomen per inwoner in Bornerbroek ligt rond € 32.000 per jaar.

Hoe veilig is wonen in Bornerbroek?

Voor het huidige jaar gaat het om ongeveer 40 geregistreerde misdrijven. Gebruik deze cijfers als indicatie en vergelijk trends per periode.

Welke woningtypen komen het meest voor in Bornerbroek?

In Bornerbroek komt vooral "Vrijstaande woningen" veel voor, met ongeveer 426 woningen.

Receive free, non-binding quotes

Compare multiple real estate agents and choose the best match.