IQ Makelaars Oost-Groningen
IQ Makelaars Oost-Groningen staat voor betrouwbare en persoonlijke makelaarsdienst in Winschoten. Met een duidelijke focus op klantgerichtheid en kwaliteit, helpen wij je graag bij het kopen of verkopen van jouw woning. In onze regio gevestigd, staan wij voor een vertrouwde partner die je door elke stap heen begeleidt. Onze werkwijze is gebaseerd op transparantie, professionaliteit en een persoonlijke aanpak. Wij leggen de nadruk op des...
Current housing stock
-

- Available
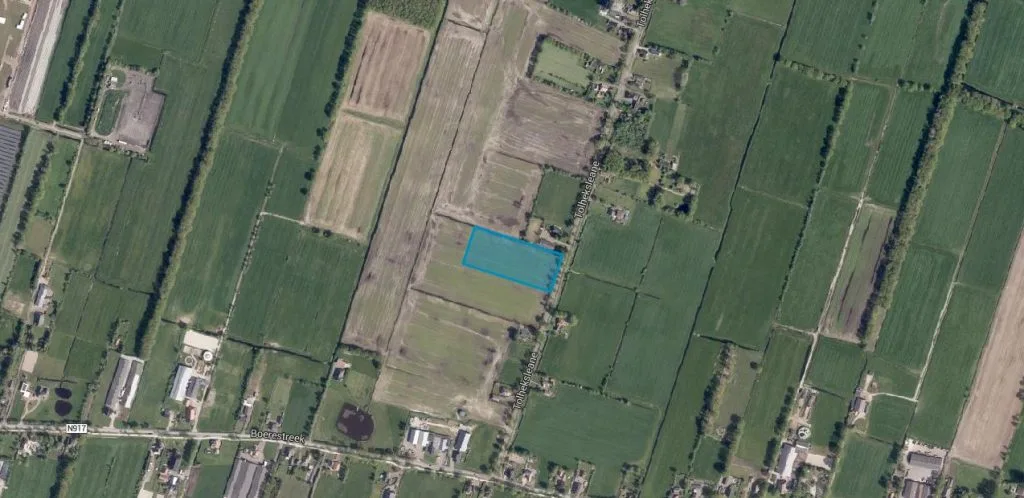
Venneweg 14
9541XN Vlagtwedde
€ 439.500 k.k.
€ 3.381/m²
CSave as favorite- Living area
- 130 m²
- Land area
- 3220 m²
- Bedrooms
- 3
-

- Available
Wilhelminaplein 6
9686RA Beerta
€ 749.500 k.k.
€ 4.283/m²
Save as favorite- Living area
- 175 m²
- Land area
- 1055 m²
- Bedrooms
- 4
-

- Available
Schepperbuurt 48
9949PJ Borgsweer
€ 695.000 k.k.
€ 3.658/m²
A+++Save as favorite- Living area
- 190 m²
- Land area
- 2071 m²
- Bedrooms
- 4
-

- Available
Hoofdkanaal OZ 109
7881VR Emmer-Compascuum
€ 949.500 k.k.
€ 2.422/m²
DSave as favorite- Living area
- 392 m²
- Land area
- 9475 m²
- Bedrooms
- 7
-

- Sold subject to confirmation
Hoofdweg 65
9687PK Nieuw Beerta
€ 219.500 k.k.
€ 1.925/m²
GSave as favorite- Living area
- 114 m²
- Land area
- 406 m²
- Bedrooms
- 1
-

- Sold
Waterlelie 7
9679ME Scheemda
€ 389.500 k.k.
€ 3.541/m²
ASave as favorite- Living area
- 110 m²
- Land area
- 290 m²
- Bedrooms
- 4
Reviews (35)
Review platforms
BronscoresTotal score
35 total reviews

Funda
22 reviews on Funda

13 reviews on Google
-
Klinkerweg 126
9Alles ging soepel achter elkaar aan deze, makelaar laat het je goed begrijpen waardoor ik wist wat ik allemaal moest doen
-
Dillenburglaan 7
9Translated by AIFrequent contact which also resulted in a sale. Very satisfied with the quick sale and at the right price.
-
Feiko Clockstraat 141 E
9Translated by AIThe contact with the real estate agent was very good. There was always someone present who would listen to you and they fully stood up for you!
-
Eikenlaan 4 D
9Translated by AIEverything went above expectations with us. The contact was very good, and all questions were answered immediately. We were kept informed of the progress at all times. We would definitely choose this real estate agent again next time.
-
Dwingelooweg 75
10Translated by AIVery satisfied with the result of the sale of our house! Clear agreements that are kept. We definitely recommend IQ real estate agents.
-
Emmastraat 16
9Translated by AIExcellent service! The real estate agent is good but Funda is of course quite worthless. Even filling out this review is excessively irritating.
-
Noorsestraat 17
10Translated by AIContact with the real estate agent was very pleasant. Know what they are doing and are ready with advice and solutions. Knowledgeable, professional and reliable.
-
Provincialeweg 25
9Translated by AIThe contract with the real estate agent went very well. We were kept well informed about the status of affairs. The property was sold within 2 weeks. We can only recommend this real estate agent.
-
Monique Krul
10Translated by AIWe were helped so nicely by IQ Makelaars Oost-Groningen! They do everything for you, in a fair way! Highly recommended. Thank you very much for the sale of our building.
-
Ring 112
10Translated by AIThe contact went very well and definitely recommended, having an IQ broker is a great asset, they have excellent knowledge of the subject matter, we were helped very well
-
Esweg 14
10Translated by AIProfessional, extremely accurate, good communication and clear agreements: in short, the right address if you want to sell your house quickly and without worries!
-
Alicia Sleutel
10Translated by AIVery pleasant collaboration....from beginning to end we were involved. The employees were always accessible which helped us a lot with the choices that came our way regarding the sale of our old house and the purchase of our new house. Very satisfied... Corrie and Karel
-
Germondylaan 45
10Translated by AIWent very well, would do it again like this. Henry is a great realtor and we bought a beautiful house.
-
Jan R. Stuutstraat F 13
9Translated by AIGreat people who work very neatly and clearly, Very open and respectful, from whom you know they really have expertise.
-
Kerkweg 6
10Translated by AIHenry Kamp from IQ Makelaars is absolutely a top performer. He always thinks along, is super professional and takes that extra step to ensure everything runs smoothly. The contact with Henry is incredibly pleasant; he takes the time for you and gives clear advice. Thanks to his commitment and knowledge, the entire process went without worries. I am extremely satisfied and would recommend him 100% to anyone looking for a reliable and engaged broker!
-
B B
2Translated by AII went along with an inspection by an acquaintance to a house familiar to me for technical support. Henry Kamp is a fluent conversationalist who you easily let lead, and in practice you have to be careful about that. He told several things that turned out not to be entirely true. My acquaintance also had difficulty making contact and getting responses back, which took at least several days and he always got his son Armand Kamp on the line, who turned out to be his assistant, who then had to ask his father. It was slow and inefficient. I also see that his son left a 5-star review here, which unfortunately cannot be objective. Also, most of the reviews on the website are not about this realtor; they were usually from a realtor from Midden-Groningen and not Oost-Groningen. I would not recommend this realtor.
-
Borgweg 9
9Translated by AIExcellent coverage, empathetic, helpful and clear explanation. We were always welcome with questions, didn't feel like a burden. Are very satisfied.
-
Sanne Christensen
10Translated by AICozy real estate agents who think along well and offer good service!
-
Anica Bruinsma
10Translated by AIDefinitely recommended! They sold my house quickly & well. Top team
-
Ad
2Translated by AII went along with an inspection by an acquaintance to a house familiar to me for technical support. Henry Kamp is a fluent conversationalist who you easily let lead, and in practice you have to be careful about that. He told several things that turned out not to be entirely true. My acquaintance also had difficulty making contact and getting responses back, which took at least several days and he always got his son Armand Kamp on the line, who turned out to be his assistant, who then had to ask his father. It was slow and inefficient. I also see that his son left a 5-star review here, which unfortunately cannot be objective. Also, most of the reviews on the website are not about this realtor; they were usually from a realtor from Midden-Groningen and not Oost-Groningen. I would not recommend this realtor.