Residents
25.442
Last year: 2026
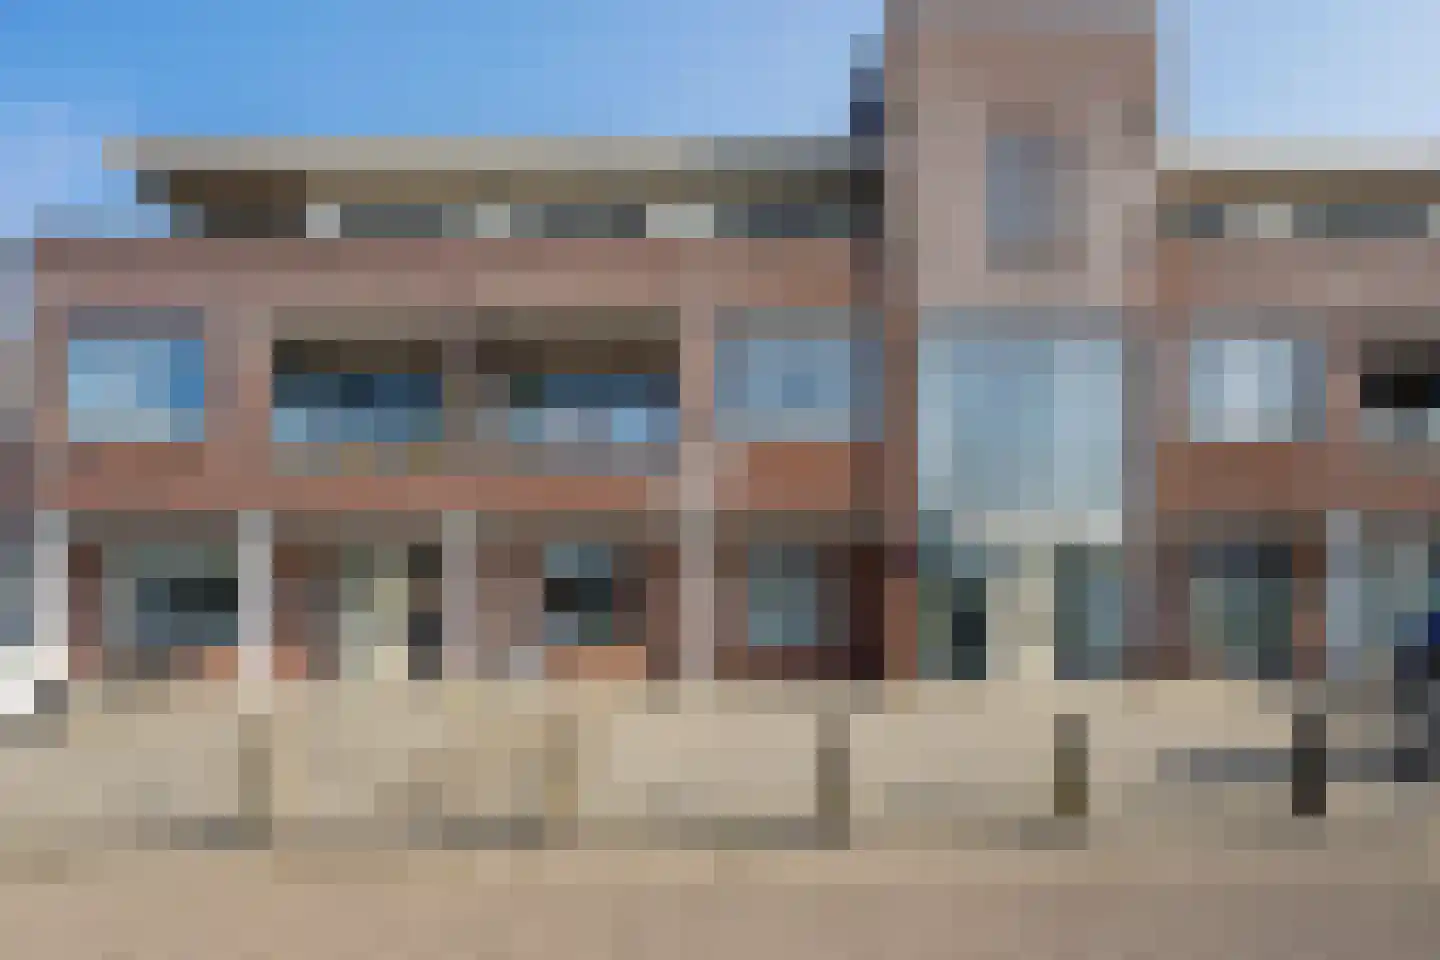
3741ZA Baarn • Utrecht
€ 425.000 k.k.
Cost of copper (estimated): € 10.350
2% transfer tax (€ 8.500) + notary (€ 1.150) + valuation (€ 700)
Total incl. VAT: € 435.350
Purchase price /m²: € 5.380
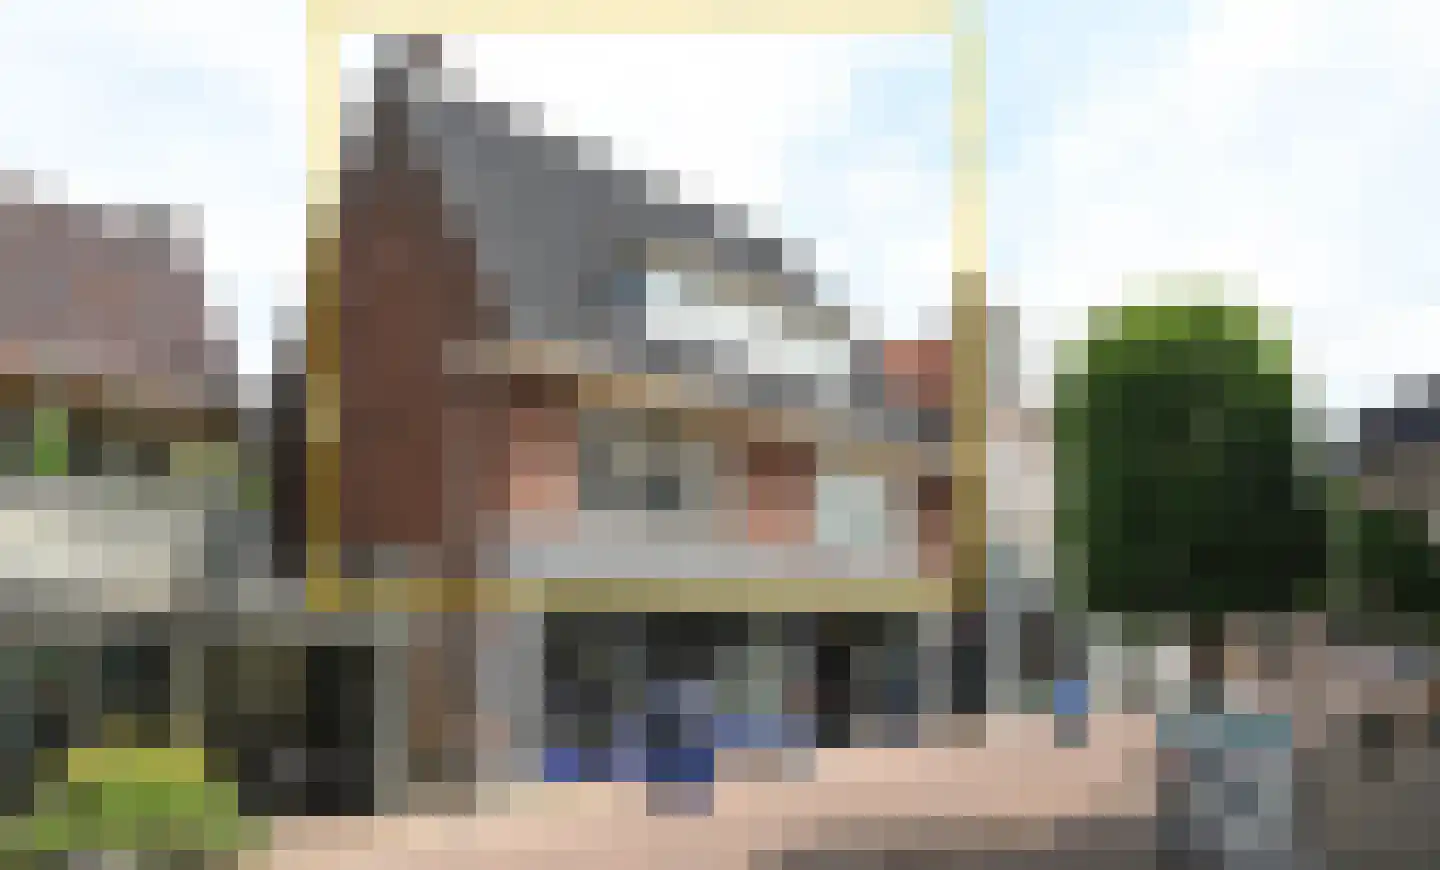
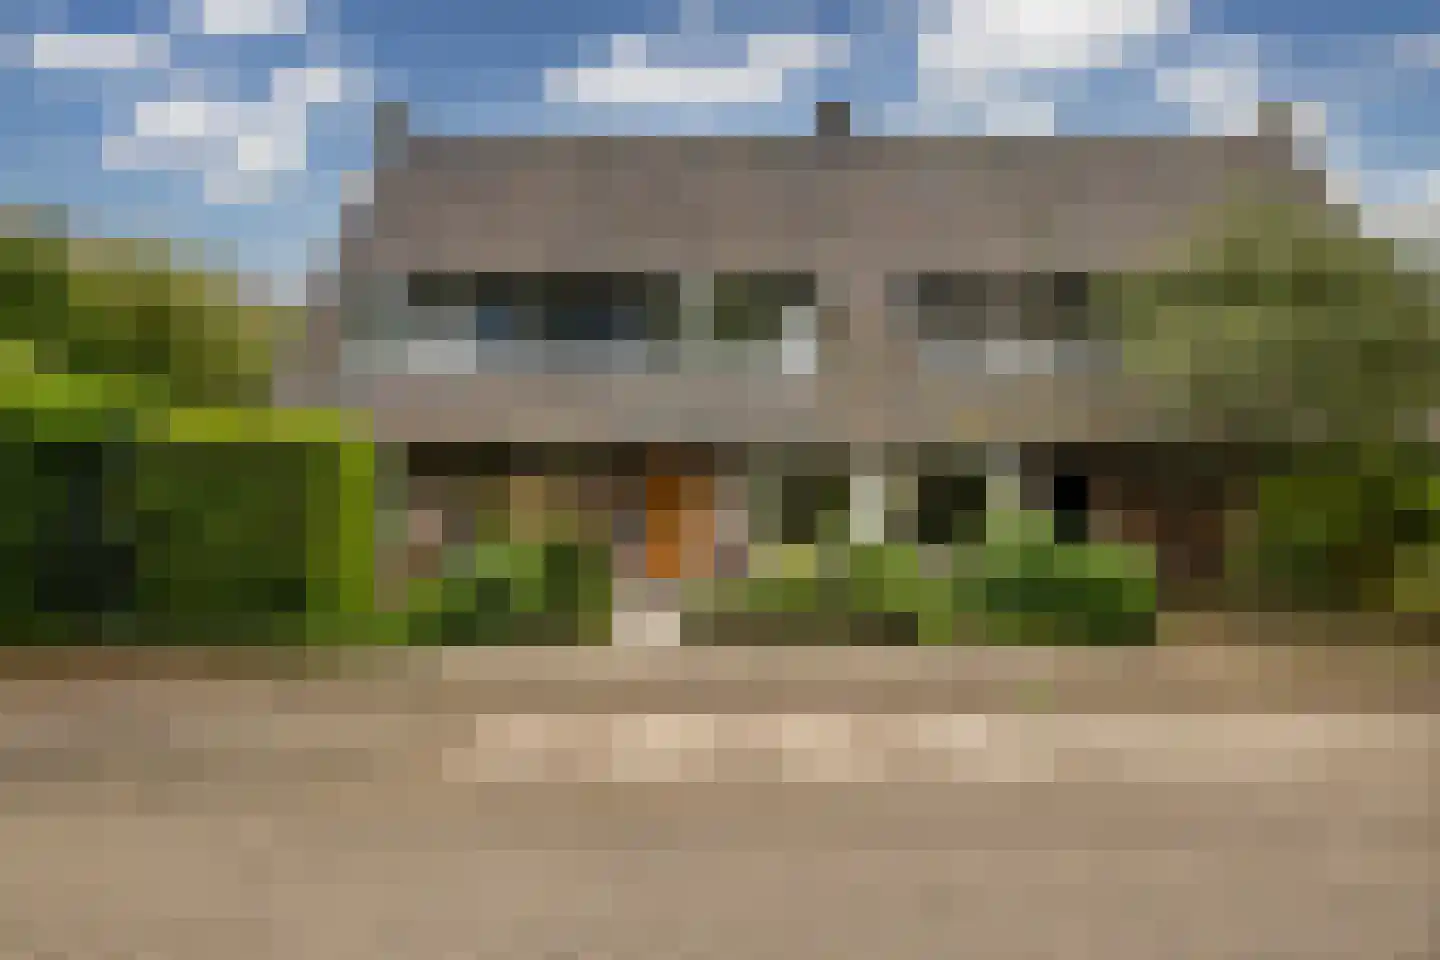
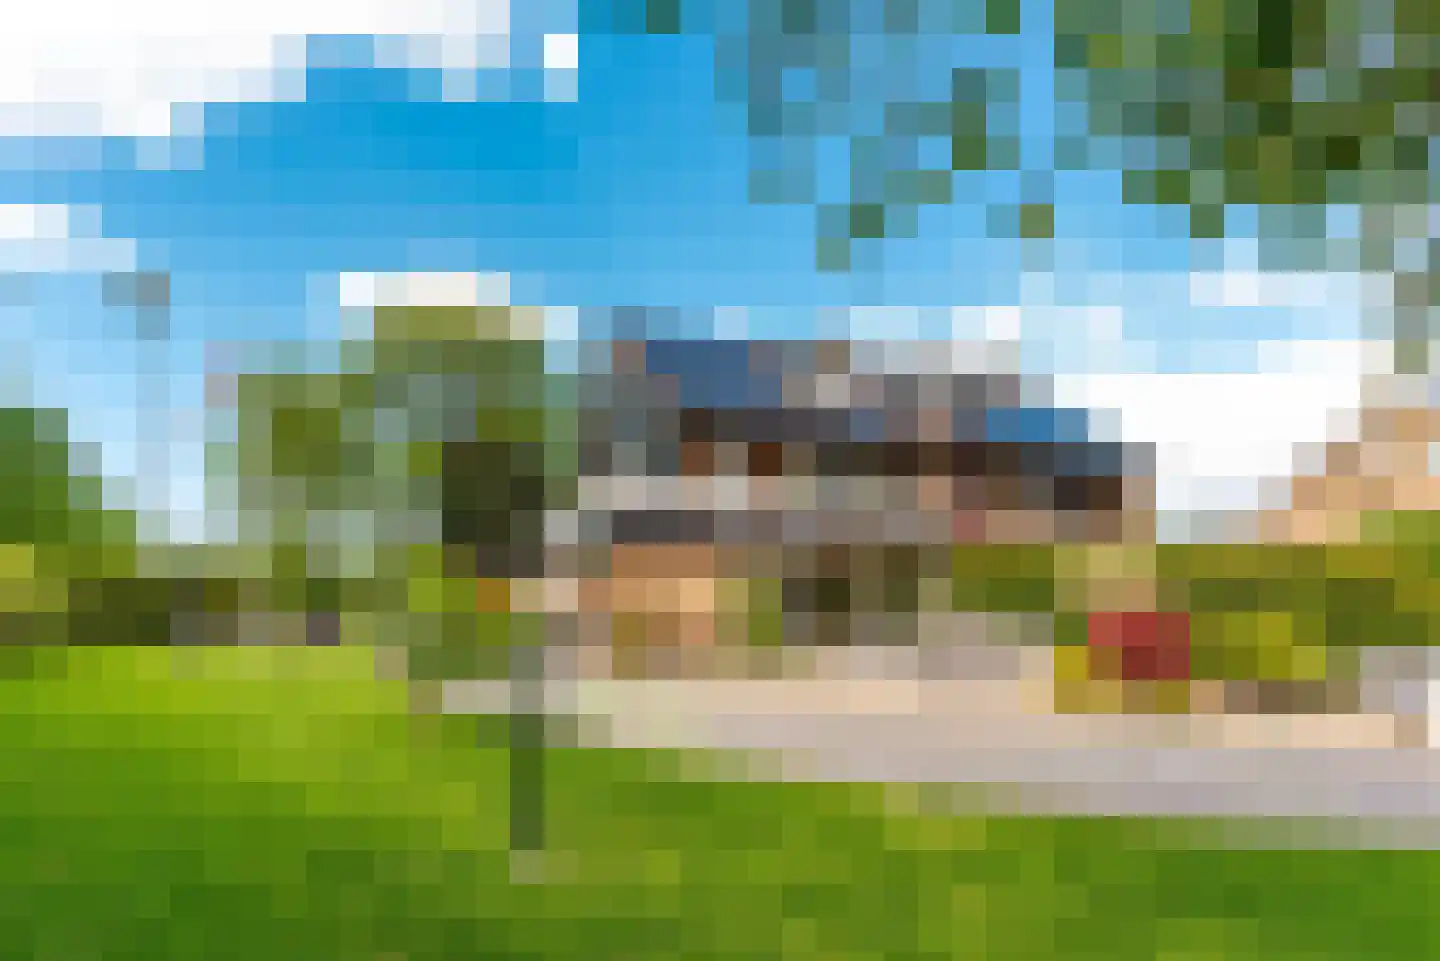
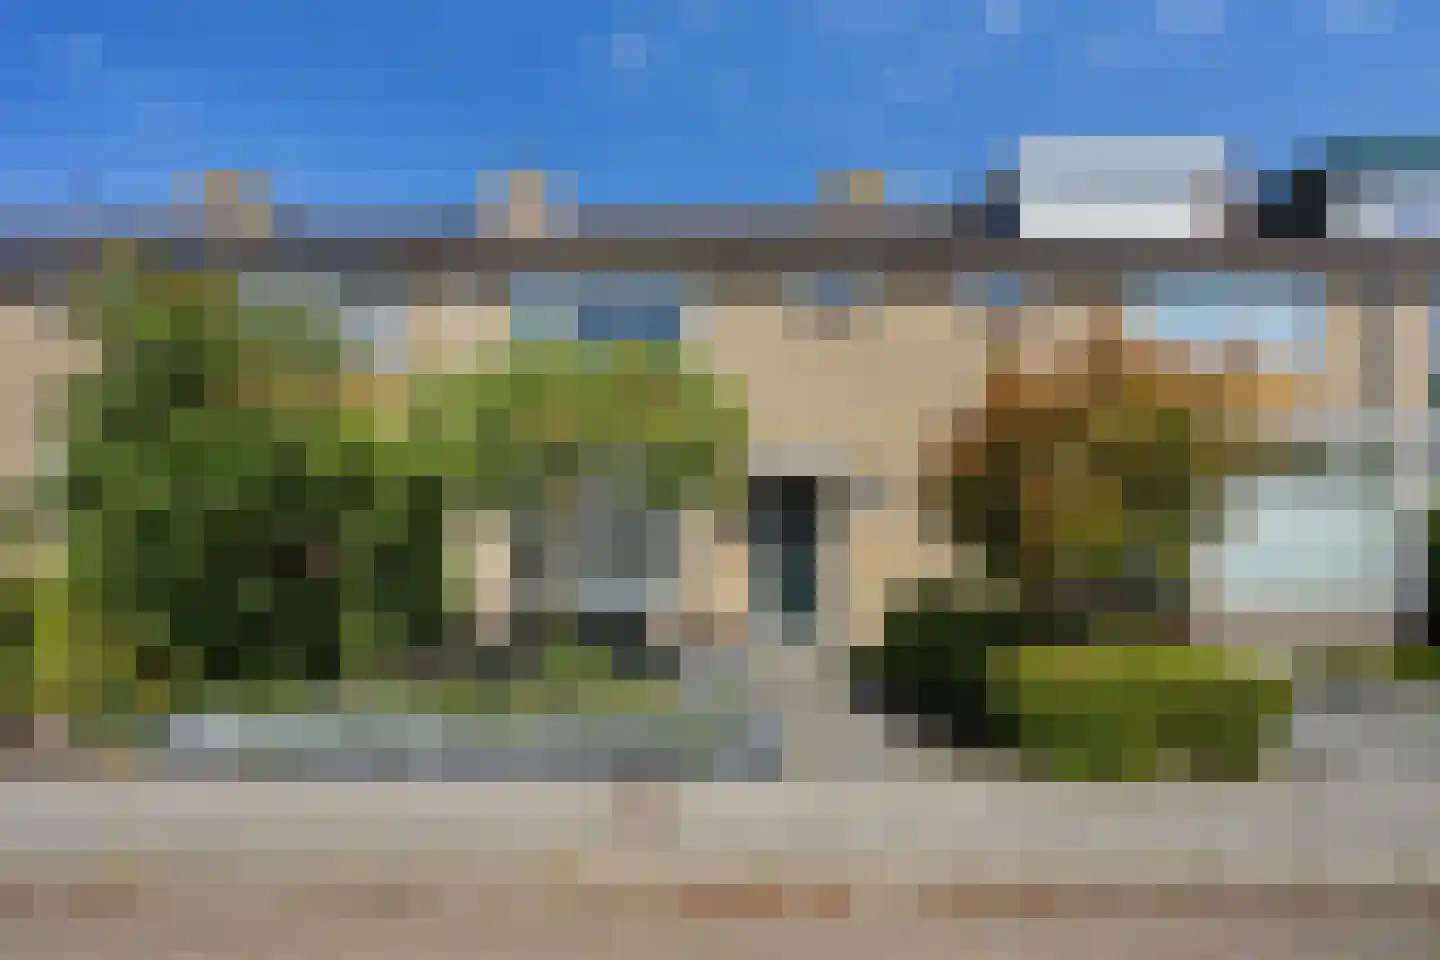
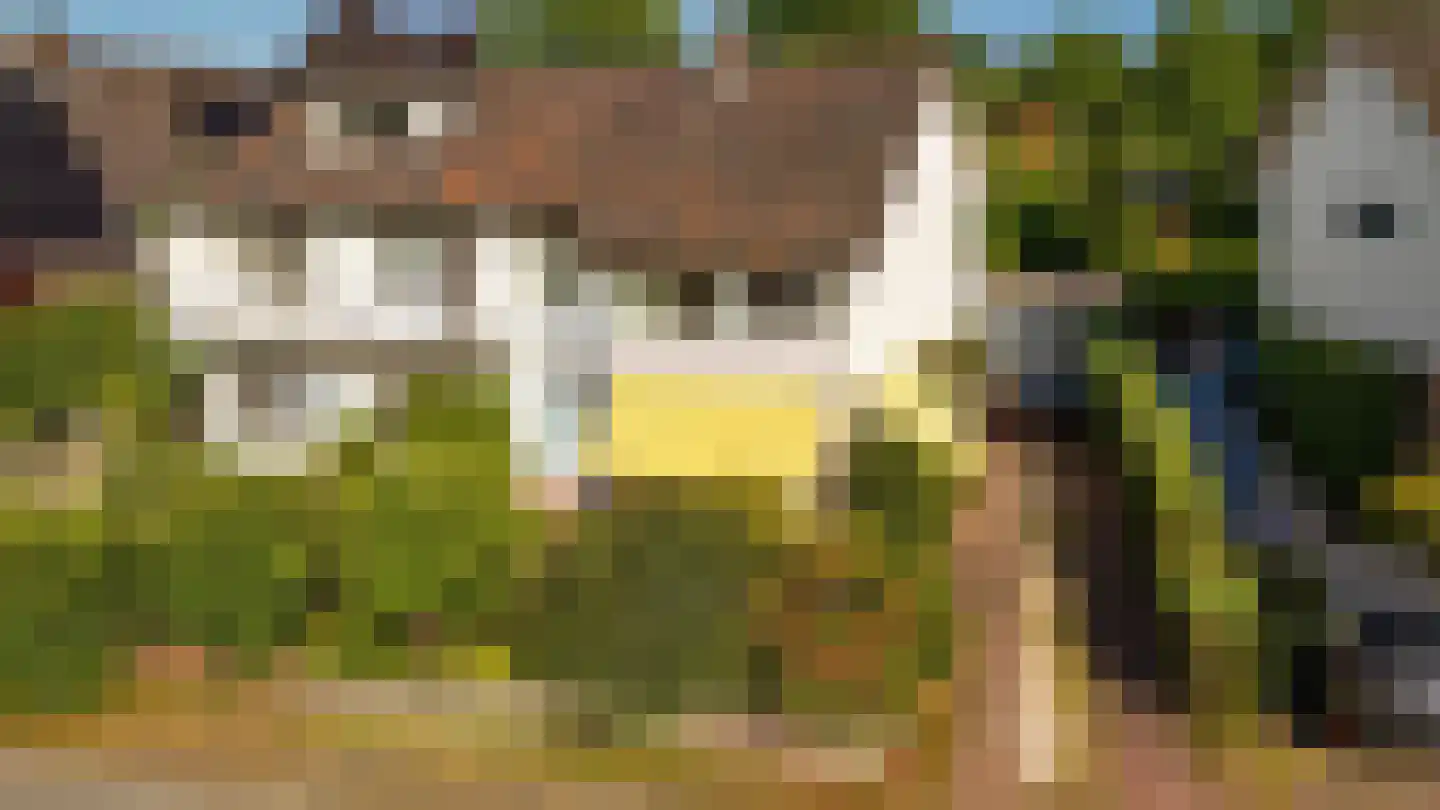
Gelegen op de eerste verdieping bevindt zich dit moderne, uitstekend geïsoleerde en lichte 3-kamerappartement. Met een balkon op het zuiden met zicht richting openbaar groen. Op de begane grond een fietsenberging. Indeling Afgesloten centrale entree met intercom, trappenhuis en lift. Appartement Bij binnenkomst kom je in de hal met meterkast en een separaat toilet met fonteintje. De ruime en sfeervolle woonkamer beschikt over grote raampartijen, wat zorgt voor een prettige lichtinval en een mooi uitzicht richting het plantsoen. Vanuit de woonkamer heb je via een schuifpui toegang tot het ruime, inpandige balkon, gelegen op het zuiden en voorzien van zonwering. De halfopen keuken v.v. inbouwapparatuur in hoekopstelling, biedt voldoende werk- en opbergruimte, de badkamer is praktisch ingericht en voorzien van een douche en wastafelmeubel, daarnaast is er een aparte stook-/wasruimte aanwezig. Het appartement beschikt over een ruime hoofdslaapkamer van circa 14 m² en een tweede kamer die uitstekend geschikt is als werk-, logeer- of kinderkamer. Kortom; Een comfortabel en modern appartement met een prettige indeling, twee slaapkamers en een zonnig inpandig balkon. Kenmerken; - Woonoppervlakte ca. 79 m² - Berging begane grond - Gunstig gelegen nabij uitvalswegen - Nabij buurtwinkels en sportcentrum De Trits - Op fietsafstand van Groeneveld - Servicekosten: € 182,47 per maand Aanvaarding: in overleg
€ 425.000
Cost of copper (estimated): € 10.350
2% transfer tax (€ 8.500) + notary (€ 1.150) + valuation (€ 700)
Total purchase (incl. p.p.): € 435.350
3,02%
Yearly
€ 21.250
Direct available
Estimated mortgage
Indicative gross monthly cost
Based on annuity and 30 year term
Indicative net monthly cost
iDisclaimer: this mortgage calculation is a simplified indication based on general assumptions. No rights can be derived from the results shown. Calculated with 10-annual interest (met NHG), automatically determined based on the price limit € 470.000. Source: 10-jaars rente uit mortgage_rates (08-06-2026 03:45).
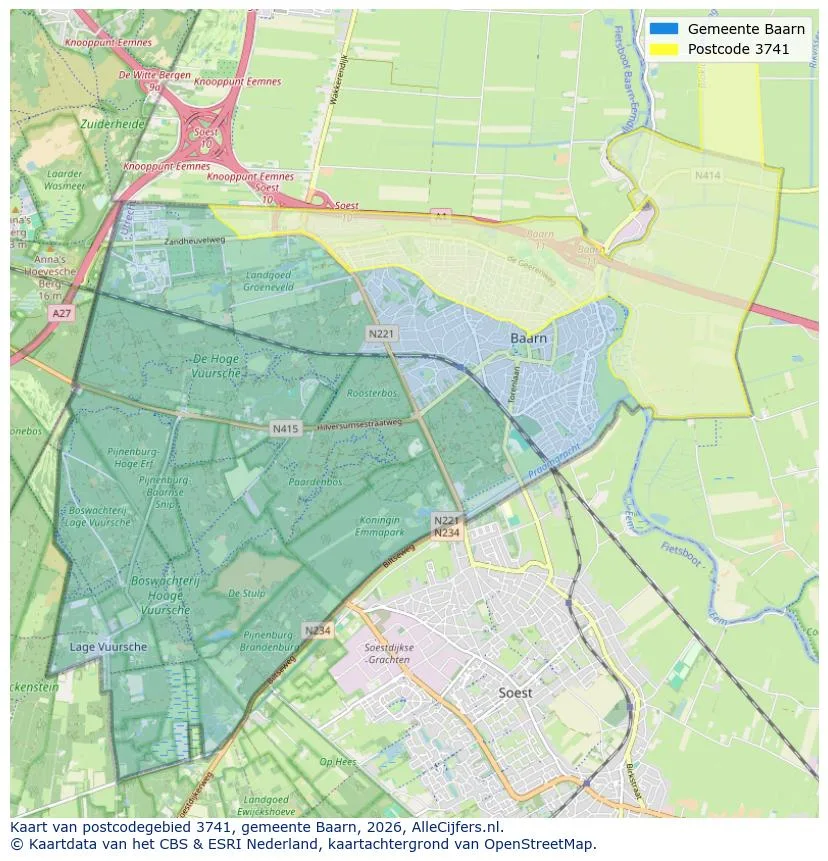
Spatial overview of the work area in Baarn
View current location data on residents, WOZ development, housing stock, energy consumption, business activity and safety in Baarn. In 2026 were there 25.442 residents. The average WOZ value in 2025 is EUR 508.000.
Residents
25.442
Last year: 2026
Average WOZ
EUR 508.000
Last year: 2025
Average income per person.
EUR 41.200
Source: AllNumbers
Crimes (current year)
989
Total registered
| Year | Residents |
|---|---|
| 2022 | 24.876 |
| 2023 | 25.008 |
| 2024 | 25.065 |
| 2025 | 25.184 |
| 2026 | 25.442 |
| Year | Average WOZ |
|---|---|
| 2021 | EUR 373.000 |
| 2022 | EUR 410.000 |
| 2023 | EUR 470.000 |
| 2024 | EUR 490.000 |
| 2025 | EUR 508.000 |
Hoger
40
Praktisch
25
Middelbaar
35
Europa
1.815
Nederland
19.672
Buiten Europa
3.697
Label C
3.076
Label A
2.058
Label B
1.613
Label G
1.597
Label E
1.229
Label D
1.186
Label F
934
Label A+
292
Label A+++
246
Label A++
241
Label A++++
15
Label A+++++
2
| Year | Gas (m3) | Electricity (kWh) |
|---|---|---|
| 2020 | 1.370 | 2.850 |
| 2021 | 1.560 | 2.900 |
| 2022 | 1.210 | 2.720 |
| 2023 | 1.030 | 2.560 |
| 2024 | 990 | 2.610 |
Hoekwoning
Gas: 1.060 • Electricity: 2.630
Huurwoning
Gas: 760 • Electricity: 1.880
Koopwoning
Gas: 1.190 • Electricity: 2.970
Appartement
Gas: 680 • Electricity: 1.780
Tussenwoning
Gas: 920 • Electricity: 2.350
Vrijstaande woning
Gas: 1.950 • Electricity: 4.460
Twee-onder-één-kap woning
Gas: 1.370 • Electricity: 3.300
Total number of company establishments: 4.350
| Period | Crimes |
|---|---|
| jan 2025 | 56 |
| jan 2026 | 92 |
| jul 2025 | 101 |
| jun 2025 | 74 |
| mei 2025 | 79 |
| mrt 2025 | 81 |
| nov 2024 | 83 |
| nov 2025 | 105 |
| okt 2024 | 71 |
| okt 2025 | 90 |
| sep 2024 | 66 |
| sep 2025 | 101 |
These figures give an indicative picture of safety trends in the living environment of Baarn.
Short answers based on current local statistics, handy for a quick comparison of the living environment.
Baarn telt in 2026 ongeveer 25.442 inwoners.
De gemiddelde WOZ-waarde in Baarn is in 2025 circa € 508.000.
Het gemiddelde inkomen per inwoner in Baarn ligt rond € 41.200 per jaar.
Voor het huidige jaar gaat het om ongeveer 989 geregistreerde misdrijven. Gebruik deze cijfers als indicatie en vergelijk trends per periode.
In Baarn komt vooral "Appartementen" veel voor, met ongeveer 4.289 woningen.
View more homes in this location.
3743BG Baarn
€ 545.000 k.k.
€ 3.225/m²
3743HK Baarn
€ 975.000 k.k.
€ 5.804/m²

3743DB Baarn
€ 1.875.000 k.k.
€ 9.328/m²
3742AP Baarn
€ 517.500 k.k.
€ 5.815/m²
3741HZ Baarn
€ 895.000 k.k.
€ 5.491/m²
3741DD Baarn
€ 515.000 k.k.
€ 5.365/m²
3743CL Baarn
€ 865.000 k.k.
€ 7.269/m²
3743BB Baarn
€ 325.000 k.k.
€ 6.373/m²
