
Residents
34.180
Last year: 2025
2652GB Berkel en Rodenrijs • Zuid-Holland
€ 725.000 k.k.
Cost of copper (estimated): € 16.350
2% transfer tax (€ 14.500) + notary (€ 1.150) + valuation (€ 700)
Total incl. VAT: € 741.350
For this property, no detailed description is available yet.
€ 725.000
Cost of copper (estimated): € 16.350
2% transfer tax (€ 14.500) + notary (€ 1.150) + valuation (€ 700)
Total purchase (incl. p.p.): € 741.350
3,04%
Yearly
€ 36.250
Direct available
Estimated mortgage
Indicative gross monthly cost
Based on annuity and 30 year term
Indicative net monthly cost
iDisclaimer: this mortgage calculation is a simplified indication based on general assumptions. No rights can be derived from the results shown. Calculated with 10-annual interest (zonder NHG), automatically determined based on the price limit € 470.000. Source: 10-jaars rente uit mortgage_rates (23-04-2026 08:38). For non-NHG, an 80% mortgage of the market value has been used in this indication.
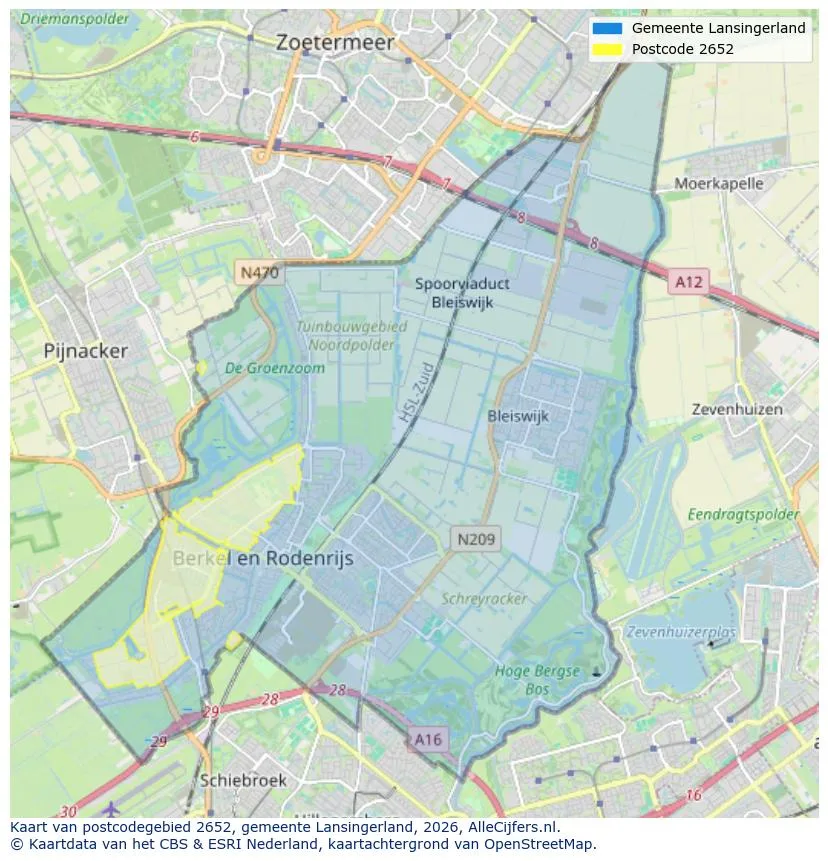
Geographic orientation and real estate agent density in Berkel en Rodenrijs
View current location data on residents, WOZ development, housing stock, energy consumption, business activity and safety in Berkel en Rodenrijs. In 2025 were there 34.180 residents. The average WOZ value in 2025 is EUR 515.365.
Residents
34.180
Last year: 2025
Average WOZ
EUR 515.365
Last year: 2025
Average income per person.
EUR 37.840
Source: AllNumbers
Crimes (current year)
1.037
Total registered
| Year | Residents |
|---|---|
| 2021 | 32.290 |
| 2022 | 32.970 |
| 2023 | 33.460 |
| 2024 | 33.970 |
| 2025 | 34.180 |
| Year | Average WOZ |
|---|---|
| 2021 | EUR 382.955 |
| 2022 | EUR 414.807 |
| 2023 | EUR 486.247 |
| 2024 | EUR 508.553 |
| 2025 | EUR 515.365 |
Hoger
10.480
Praktisch
5.220
Middelbaar
8.600
Europa
1.935
Nederland
26.015
Buiten Europa
6.240
Label A
6.662
Label C
2.127
Label B
1.766
Label D
640
Label A+++
628
Label A+
436
Label E
378
Label F
370
Label G
277
Label A++++
252
Label A++
188
Label A+++++
11
| Year | Gas (m3) | Electricity (kWh) |
|---|---|---|
| 2020 | 1.055 | 3.141 |
| 2021 | 1.168 | 3.218 |
| 2022 | 896 | 3.035 |
| 2023 | 774 | 2.828 |
| 2024 | 744 | 2.893 |
Hoekwoning
Gas: 884 • Electricity: 2.993
Huurwoning
Gas: 646 • Electricity: 2.033
Koopwoning
Gas: 825 • Electricity: 3.099
Appartement
Gas: 532 • Electricity: 1.795
Tussenwoning
Gas: 722 • Electricity: 2.742
Vrijstaande woning
Gas: 1.305 • Electricity: 4.687
Twee-onder-één-kap woning
Gas: 1.044 • Electricity: 3.656
Total number of company establishments: 4.825
| Period | Crimes |
|---|---|
| jan 2025 | 75 |
| jan 2026 | 71 |
| jul 2025 | 130 |
| jun 2025 | 103 |
| mei 2025 | 74 |
| mrt 2025 | 81 |
| nov 2024 | 68 |
| nov 2025 | 79 |
| okt 2024 | 95 |
| okt 2025 | 84 |
| sep 2024 | 61 |
| sep 2025 | 98 |
These figures give an indicative picture of safety trends in the living environment of Berkel en Rodenrijs.
Short answers based on current local statistics, handy for a quick comparison of the living environment.
Berkel en Rodenrijs telt in 2025 ongeveer 34.180 inwoners.
De gemiddelde WOZ-waarde in Berkel en Rodenrijs is in 2025 circa € 515.365.
Het gemiddelde inkomen per inwoner in Berkel en Rodenrijs ligt rond € 37.840 per jaar.
Voor het huidige jaar gaat het om ongeveer 1.037 geregistreerde misdrijven. Gebruik deze cijfers als indicatie en vergelijk trends per periode.
In Berkel en Rodenrijs komt vooral "Tussenwoningen" veel voor, met ongeveer 6.423 woningen.
View more homes in this location.

2651JB Berkel en Rodenrijs
€ 995.000 k.k.
2651JB Berkel en Rodenrijs
€ 895.000 k.k.
€ 5.927/m²

2652BZ Berkel en Rodenrijs
€ 725.000 k.k.
2651LW Berkel en Rodenrijs
€ 1.350.000 k.k.
2651PL Berkel en Rodenrijs
€ 650.000 k.k.
€ 4.221/m²
2651DG Berkel en Rodenrijs
€ 485.000 k.k.

2651NC Berkel en Rodenrijs
€ 1.090.000 k.k.

2652LL Berkel en Rodenrijs
€ 725.000 k.k.
