Residents
34.180
Last year: 2025
2651LW Berkel en Rodenrijs • Zuid-Holland
€ 1.350.000 k.k.
Cost of copper (estimated): € 28.850
2% transfer tax (€ 27.000) + notary (€ 1.150) + valuation (€ 700)
Total incl. VAT: € 1.378.850
Purchase price /m²: € 7.759
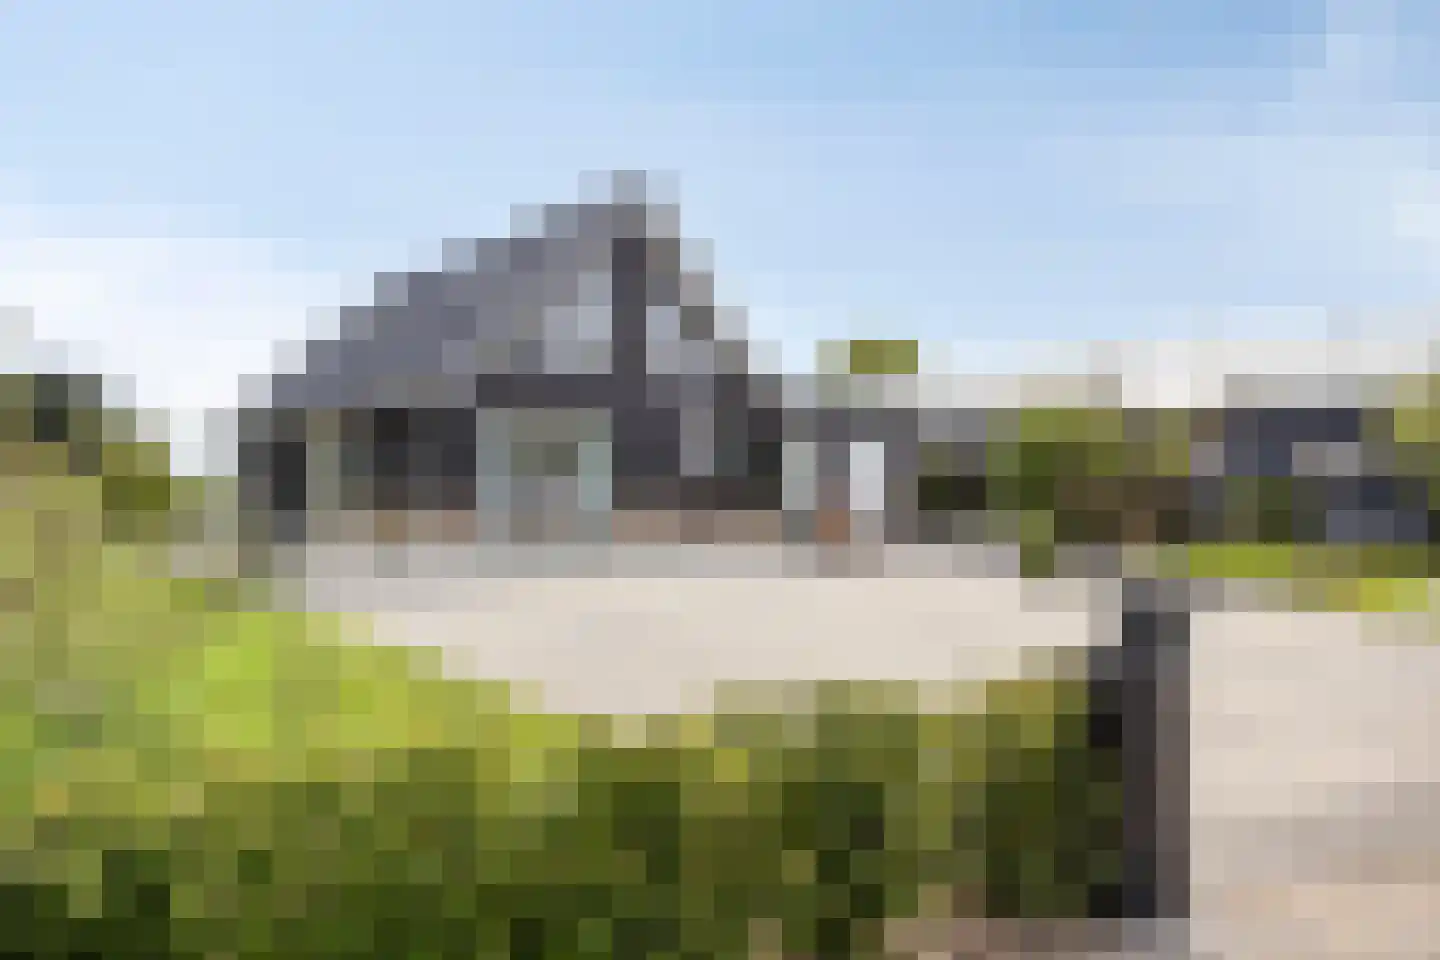
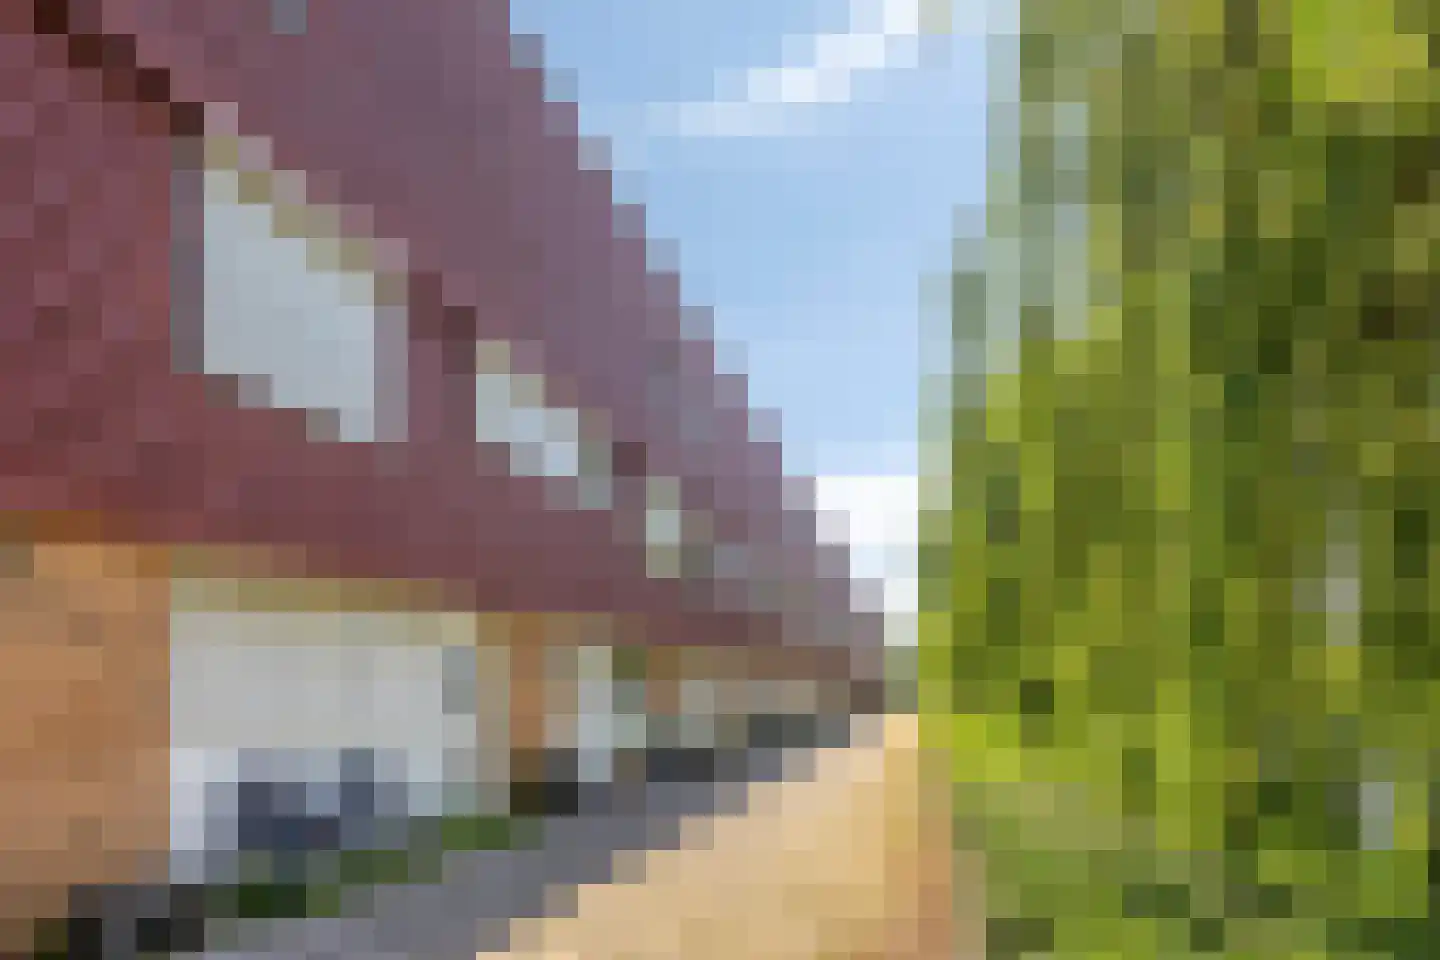
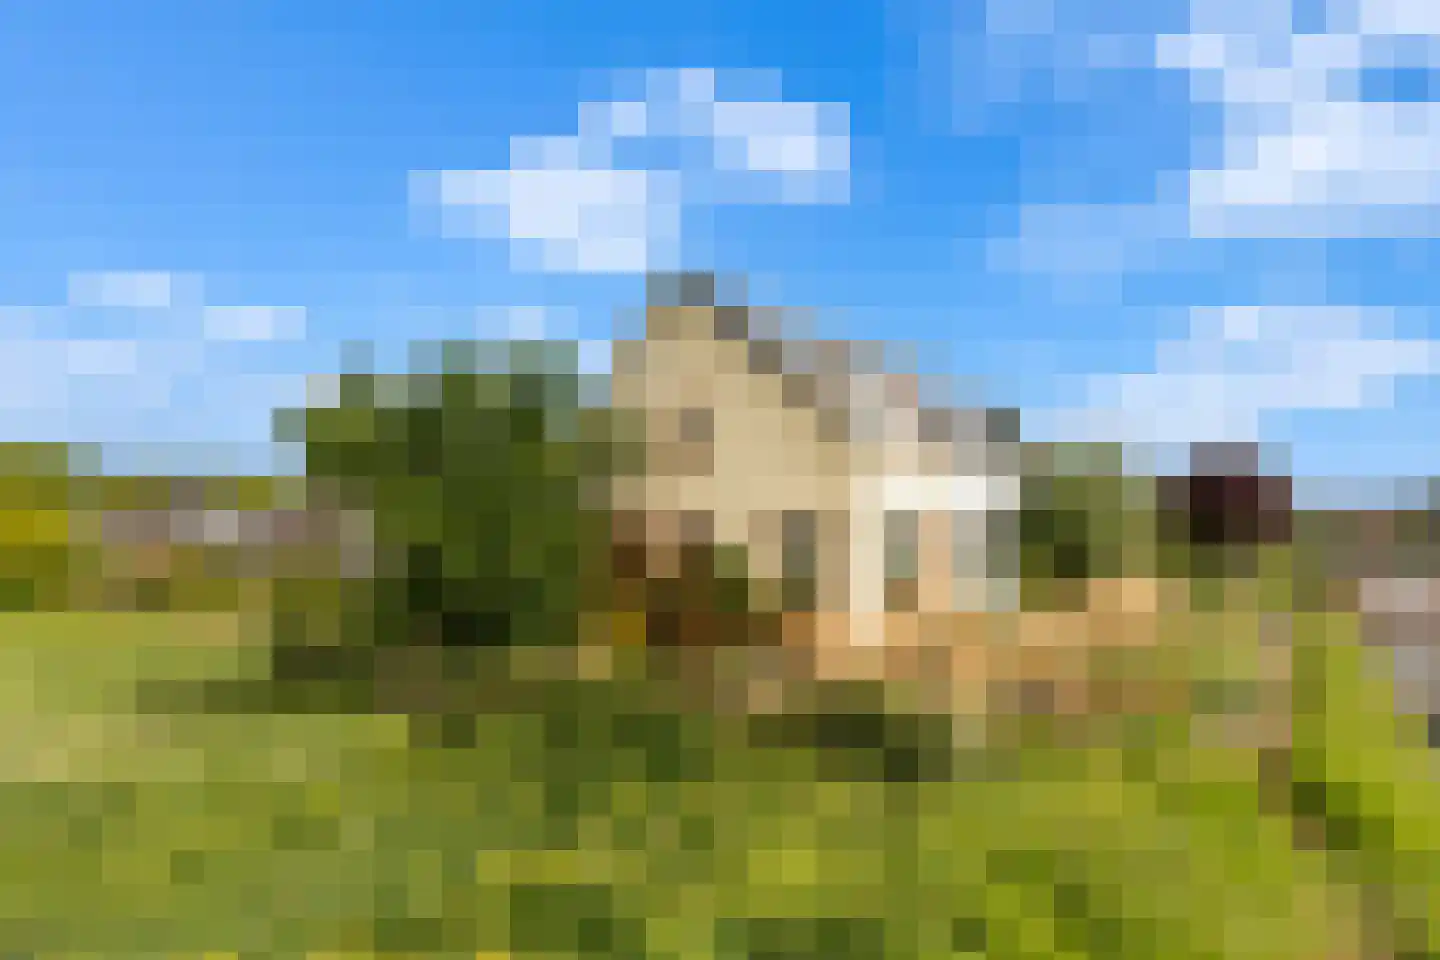
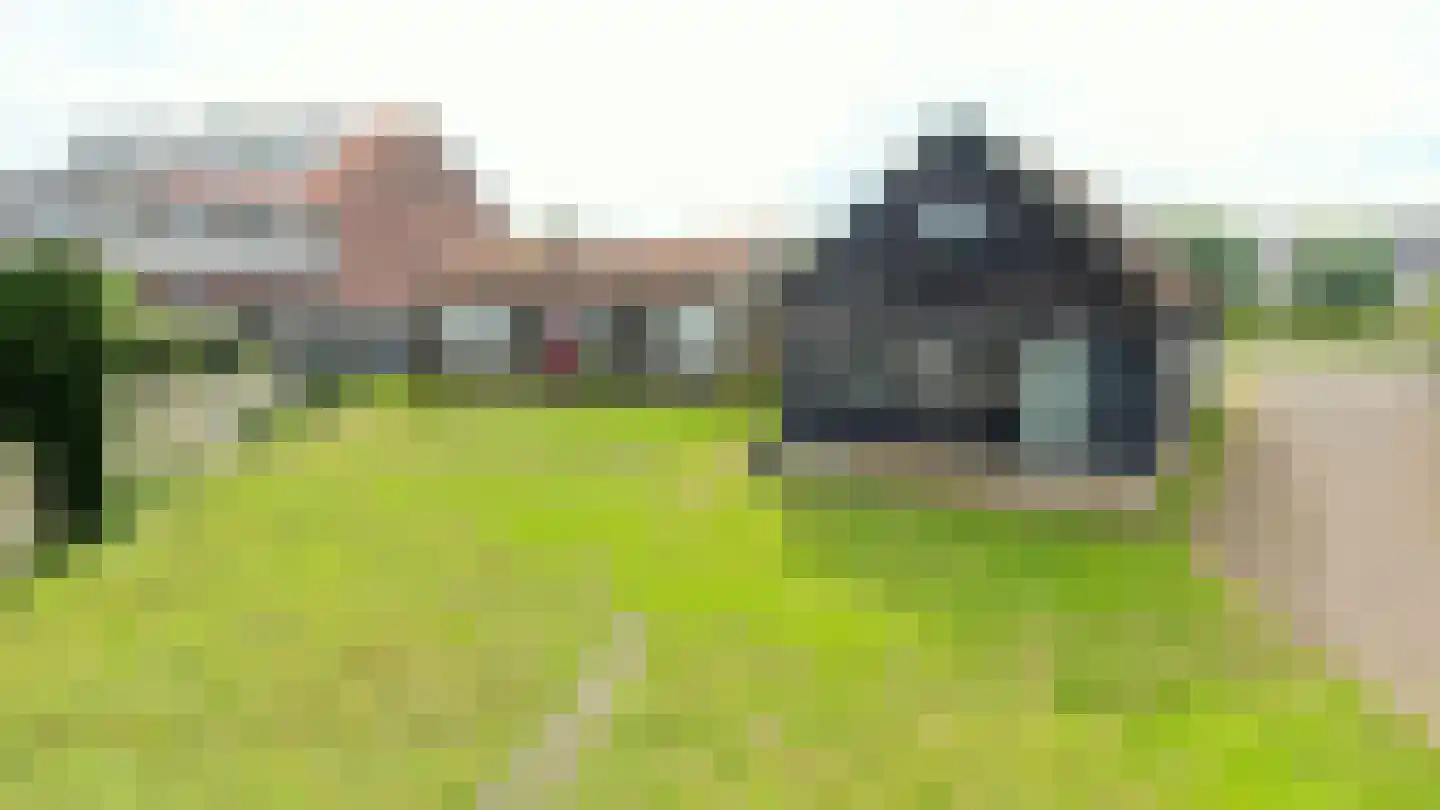
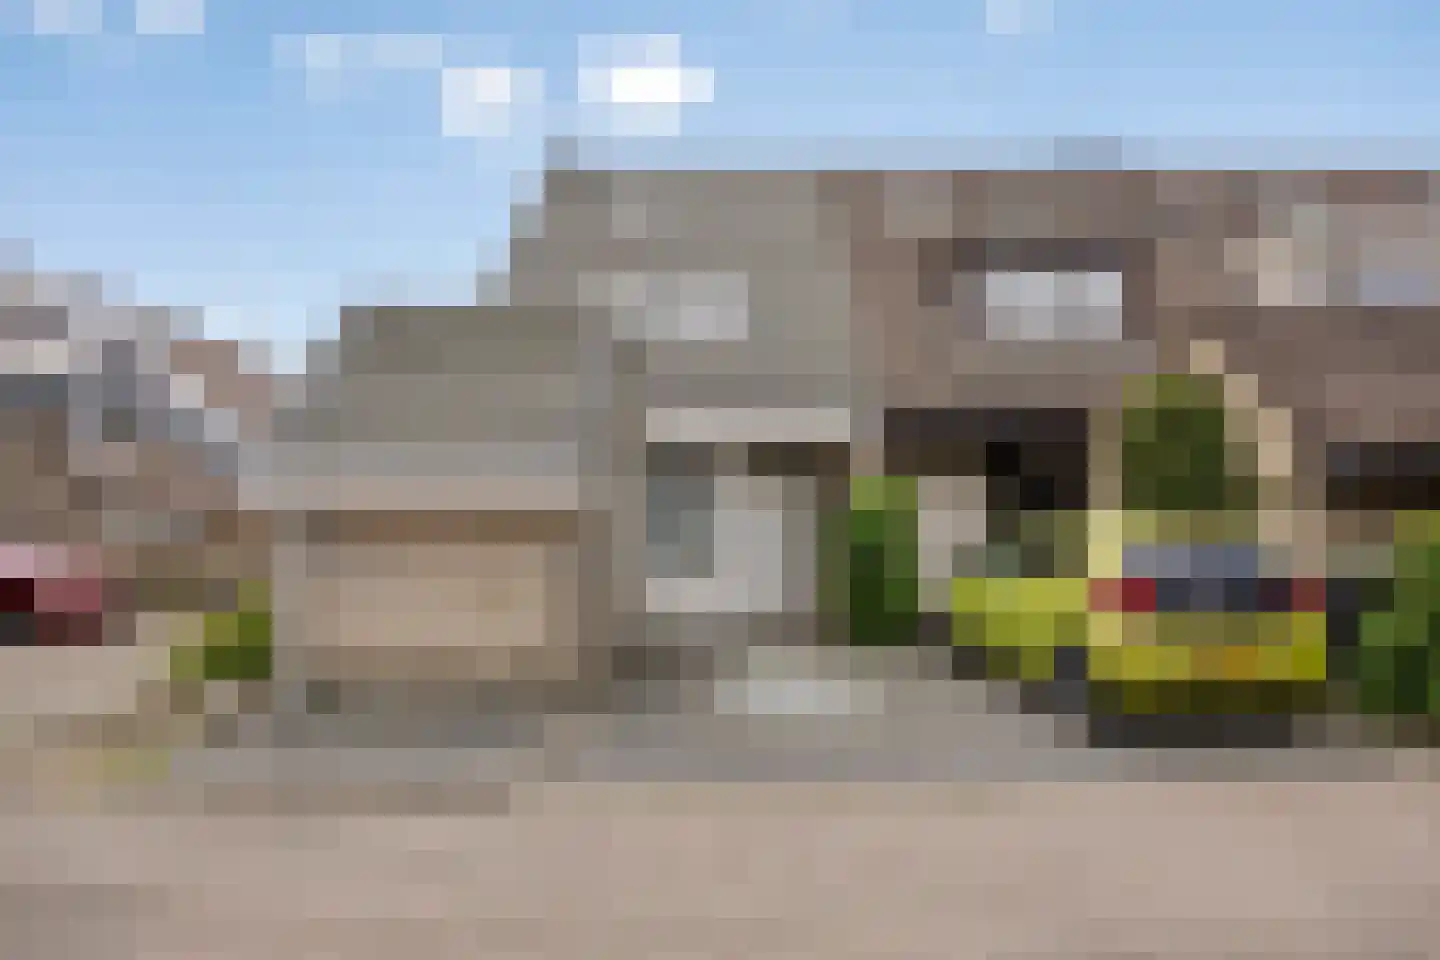
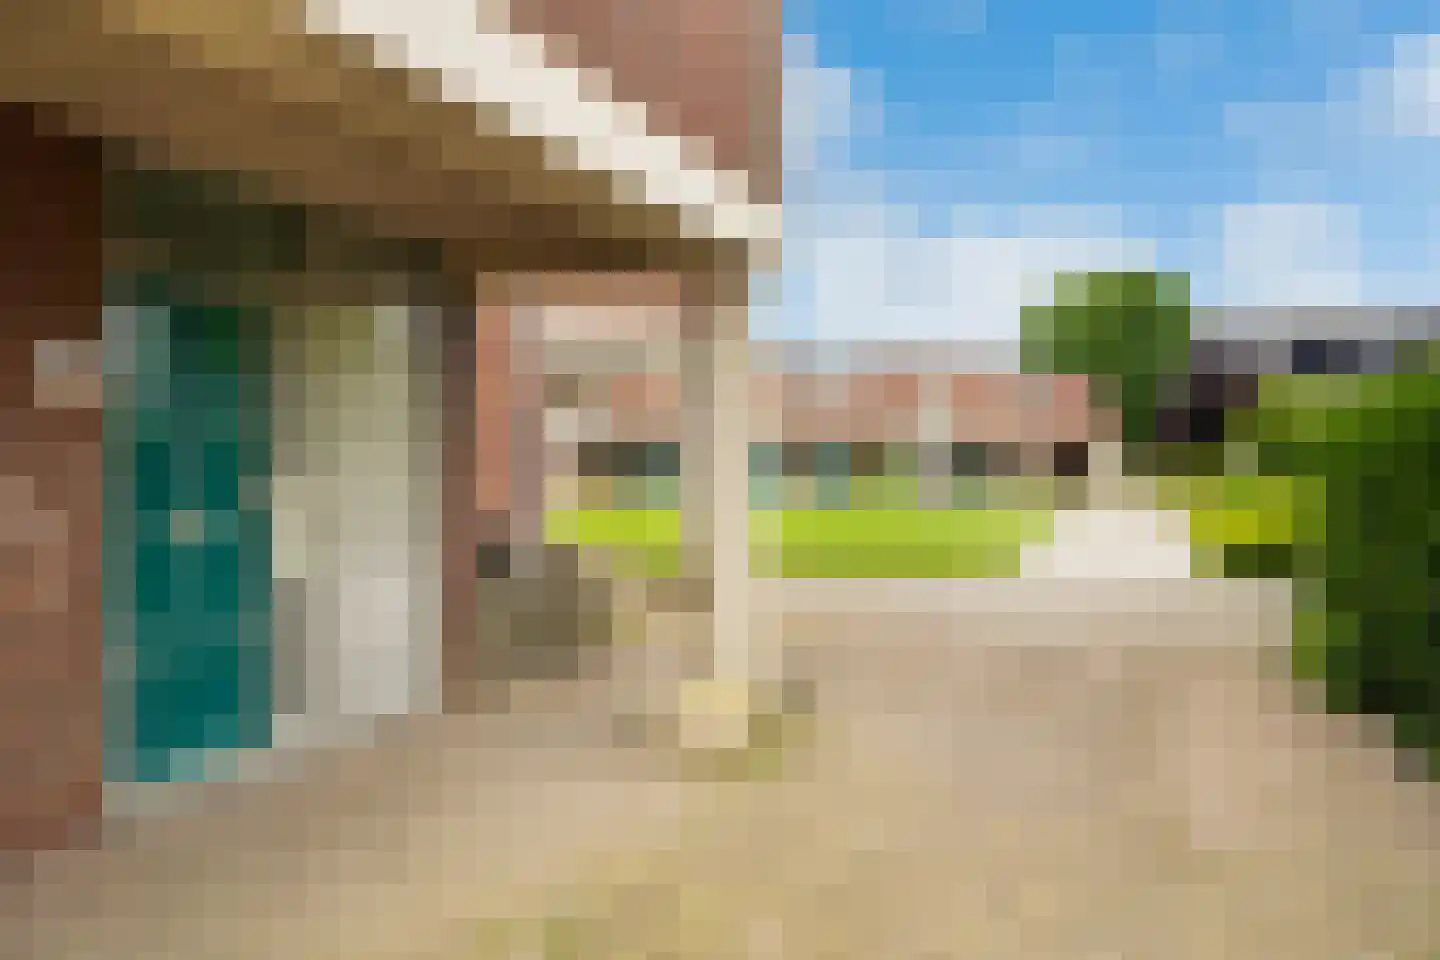
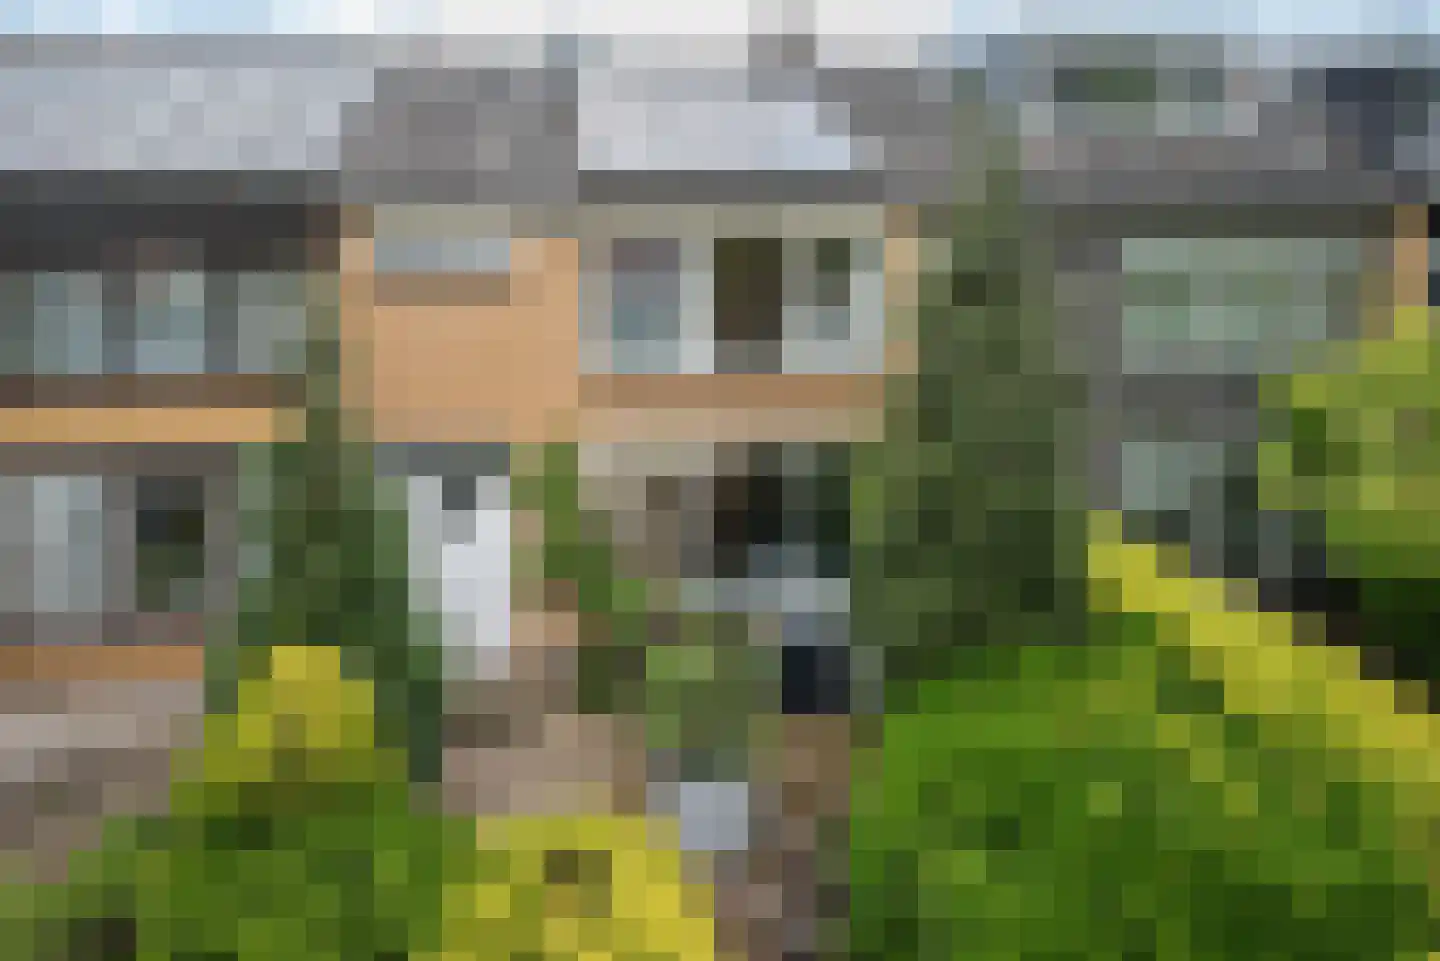
Vrijstaand en toekomstbestendig wonen aan de Noordersingel 94c in Berkel en Rodenrijs op een heerlijk ruim bemeten perceel van ca. 1.210 m2! Gelegen in een rustige en groene omgeving van Berkel en Rodenrijs waar je zo de Groenzoom in wandelt of fietst staat deze moderne vrijstaande woning (bouwjaar 2022). Een huis waar comfort, duurzaamheid en ruimte samenkomen; perfect voor wie levensbestendig wil wonen zonder concessies te doen aan stijl en uitstraling. Of voor een mooie werk- of praktijkruimte aan huis. Wonen met ruimte en licht Bij binnenkomst valt direct de prettige lichtinval en de open indeling op. De woonkamer is ruim opgezet en staat in directe verbinding met de tuin via grote raampartijen en openslaande deuren. Hier geniet je het hele jaar door van een fijne woonbeleving, met binnen en buiten die naadloos in elkaar overlopen. De moderne keuken is strak uitgevoerd en van alle gemakken voorzien. De combinatie van warme houttinten en een frisse uitstraling maakt dit een plek waar koken en samenzijn centraal staan. Levensloopbestendig en flexibel Wat deze woning extra aantrekkelijk maakt, is het levensloopbestendige karakter. Op de begane grond bevinden zich een slaapkamer en badkamer, waardoor gelijkvloers wonen mogelijk is. Ideaal voor nu én in de toekomst. Daarnaast is er een separate werkkamer; perfect voor thuiswerken of als hobbyruimte. Verdieping met mogelijkheden Op de verdieping bevinden zich meerdere ruime slaapkamers en een tweede badkamer. De zolder biedt aanvullende bergruimte. Dankzij de slimme indeling is deze verdieping flexibel in te richten, bijvoorbeeld voor een gezin of logees. Duurzaam en energiezuinig Deze woning is volledig voorbereid op de toekomst: Voorzien van een (bodem)warmtepomp en uitgerust met 26 zonnepanelen. Dit zorgt niet alleen voor een comfortabel binnenklimaat, maar ook voor lage energielasten. Buitenleven op zijn best Rondom de woning ligt een royale tuin met volop privacy. De grote overkapping aan de achterzijde vormt een verlengstuk van de woonkamer en is een heerlijke plek om te ontspannen of lange avonden buiten door te brengen. De ruime oprit en garage bieden volop parkeergelegenheid op eigen terrein. Ligging De woning ligt aan de Noordersingel, een rustige locatie met een landelijk gevoel, terwijl voorzieningen zoals winkels, scholen en uitvalswegen richting Rotterdam en Den Haag binnen korte afstand bereikbaar zijn. Daarnaast is er sprake van een mandelig terrein dat wordt gedeeld met drie omliggende woningen, wat bijdraagt aan een verzorgd en gezamenlijk onderhouden geheel, met behoud van privacy. Bijzonderheden: - Vrijstaande woning (bouwjaar 2022); - Levensloopbestendig (slaapkamer en badkamer begane grond); - Energiezuinig met warmtepomp en 26 zonnepanelen; - Ruime tuin met overkapping; - Garage en ruim parkeren op eigen terrein; - Moderne afwerking en instapklaar; - Oplevering in overleg. Deze informatie is een uitnodiging tot het doen van een bod. Ondanks het feit dat deze informatie met zorg is samengesteld, kunnen er geen rechten aan ontleend worden. Interesse in dit huis? Schakel direct uw eigen NVM-aankoopmakelaar in. Uw NVM-aankoopmakelaar komt op voor uw belang en bespaart u tijd, geld en zorgen.
€ 1.350.000
Cost of copper (estimated): € 28.850
2% transfer tax (€ 27.000) + notary (€ 1.150) + valuation (€ 700)
Total purchase (incl. p.p.): € 1.378.850
3,21%
Yearly
€ 67.500
Direct available
Estimated mortgage
Indicative gross monthly cost
Based on annuity and 30 year term
Indicative net monthly cost
iDisclaimer: this mortgage calculation is a simplified indication based on general assumptions. No rights can be derived from the results shown. Calculated with 10-annual interest (zonder NHG), automatically determined based on the price limit € 470.000. Source: 10-jaars rente uit mortgage_rates (08-06-2026 03:45). For non-NHG, an 80% mortgage of the market value has been used in this indication.
Dubbele wastafel, inloopdouche, 2 toiletten, ligbad, en wastafel
Elektra, verwarming en stromend water
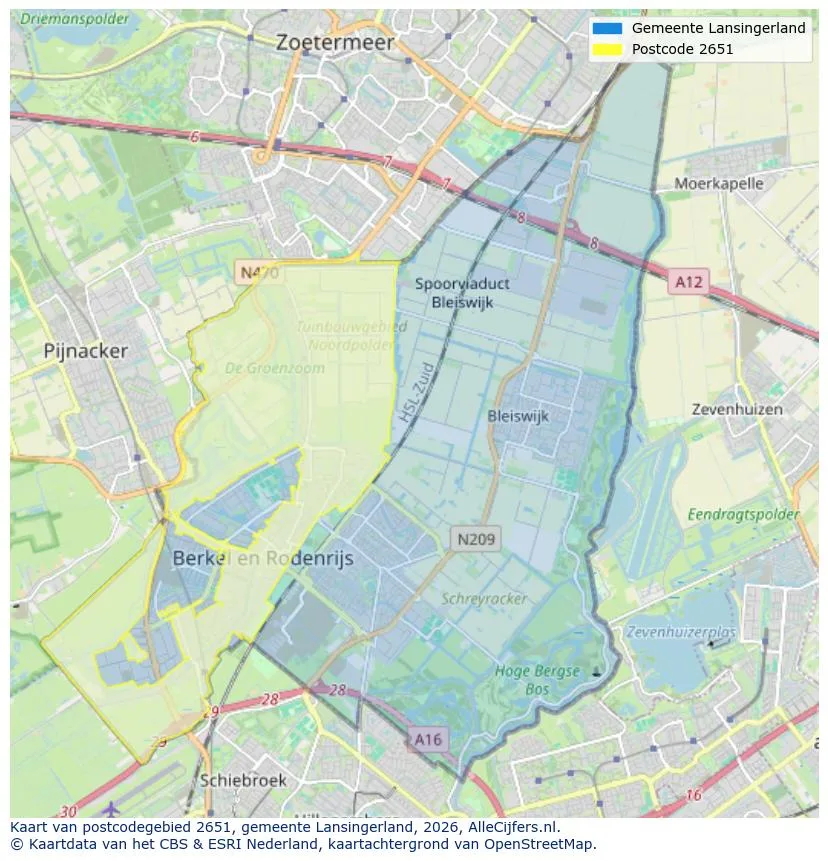
Geographic orientation and real estate agent density in Berkel en Rodenrijs
View current location data on residents, WOZ development, housing stock, energy consumption, business activity and safety in Berkel en Rodenrijs. In 2025 were there 34.180 residents. The average WOZ value in 2025 is EUR 515.365.
Residents
34.180
Last year: 2025
Average WOZ
EUR 515.365
Last year: 2025
Average income per person.
EUR 37.840
Source: AllNumbers
Crimes (current year)
1.037
Total registered
| Year | Residents |
|---|---|
| 2021 | 32.290 |
| 2022 | 32.970 |
| 2023 | 33.460 |
| 2024 | 33.970 |
| 2025 | 34.180 |
| Year | Average WOZ |
|---|---|
| 2021 | EUR 382.955 |
| 2022 | EUR 414.807 |
| 2023 | EUR 486.247 |
| 2024 | EUR 508.553 |
| 2025 | EUR 515.365 |
Hoger
10.480
Praktisch
5.220
Middelbaar
8.600
Europa
1.935
Nederland
26.015
Buiten Europa
6.240
Label A
6.662
Label C
2.127
Label B
1.766
Label D
640
Label A+++
628
Label A+
436
Label E
378
Label F
370
Label G
277
Label A++++
252
Label A++
188
Label A+++++
11
| Year | Gas (m3) | Electricity (kWh) |
|---|---|---|
| 2020 | 1.055 | 3.141 |
| 2021 | 1.168 | 3.218 |
| 2022 | 896 | 3.035 |
| 2023 | 774 | 2.828 |
| 2024 | 744 | 2.893 |
Hoekwoning
Gas: 884 • Electricity: 2.993
Huurwoning
Gas: 646 • Electricity: 2.033
Koopwoning
Gas: 825 • Electricity: 3.099
Appartement
Gas: 532 • Electricity: 1.795
Tussenwoning
Gas: 722 • Electricity: 2.742
Vrijstaande woning
Gas: 1.305 • Electricity: 4.687
Twee-onder-één-kap woning
Gas: 1.044 • Electricity: 3.656
Total number of company establishments: 4.825
| Period | Crimes |
|---|---|
| jan 2025 | 75 |
| jan 2026 | 71 |
| jul 2025 | 130 |
| jun 2025 | 103 |
| mei 2025 | 74 |
| mrt 2025 | 81 |
| nov 2024 | 68 |
| nov 2025 | 79 |
| okt 2024 | 95 |
| okt 2025 | 84 |
| sep 2024 | 61 |
| sep 2025 | 98 |
These figures give an indicative picture of safety trends in the living environment of Berkel en Rodenrijs.
Short answers based on current local statistics, handy for a quick comparison of the living environment.
Berkel en Rodenrijs telt in 2025 ongeveer 34.180 inwoners.
De gemiddelde WOZ-waarde in Berkel en Rodenrijs is in 2025 circa € 515.365.
Het gemiddelde inkomen per inwoner in Berkel en Rodenrijs ligt rond € 37.840 per jaar.
Voor het huidige jaar gaat het om ongeveer 1.037 geregistreerde misdrijven. Gebruik deze cijfers als indicatie en vergelijk trends per periode.
In Berkel en Rodenrijs komt vooral "Tussenwoningen" veel voor, met ongeveer 6.423 woningen.
View more homes in this location.

2652HK Berkel en Rodenrijs
€ 935.000 k.k.
€ 6.233/m²
2652CS Berkel en Rodenrijs
€ 530.000 k.k.
€ 4.344/m²
2651BV Berkel en Rodenrijs
€ 550.000 k.k.
€ 5.914/m²
2651CX Berkel en Rodenrijs
€ 650.000 k.k.
2651SX Berkel en Rodenrijs
€ 515.000 k.k.
€ 4.598/m²

2652GP Berkel en Rodenrijs
€ 1.050.000 k.k.
2651HL Berkel en Rodenrijs
€ 389.500 k.k.
€ 4.477/m²
2651DL Berkel en Rodenrijs
€ 489.000 k.k.
€ 5.494/m²
