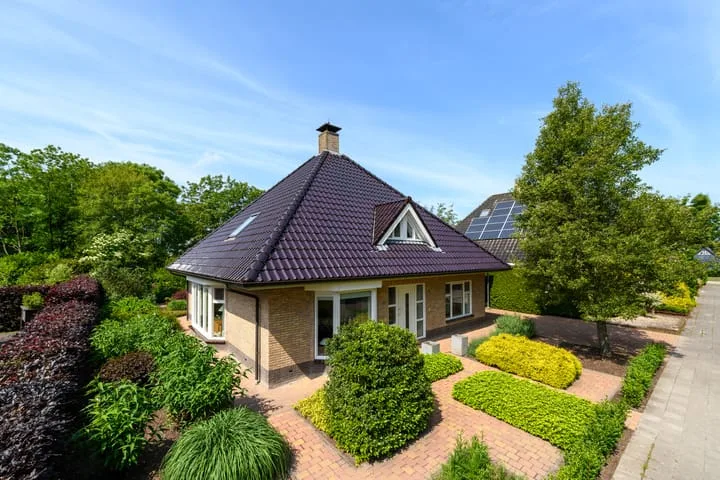
- Sold
De Achtkant 1
9285VH Buitenpost
€ 535.000 k.k.
€ 2.891/m²
- Living area
- 185 m²
- Land area
- 635 m²
- Bedrooms
- 6
View 42 sold houses in Buitenpost
Type to search. Use arrow down and arrow up to navigate through results and press Enter to open.
Hidden search suggestions.
Compare sold homes in Buitenpost or view the current offering in this location directly.
On this page you will find recently sold homes in Buitenpost. Use this overview to better estimate selling prices, popular neighborhoods, and the local housing supply before you choose a real estate agent. Also view the current housing supply with 56 houses in Buitenpost.
9285VH Buitenpost
€ 535.000 k.k.
€ 2.891/m²
9285LH Buitenpost
€ 575.000 k.k.
€ 3.194/m²
9285RV Buitenpost
€ 335.000 k.k.
€ 2.745/m²
9285RH Buitenpost
€ 295.000 k.k.
€ 2.543/m²
9285SH Buitenpost
€ 249.000 k.k.
€ 2.394/m²
9285PW Buitenpost
€ 639.000 k.k.
€ 2.730/m²
9285NS Buitenpost
€ 720.000 k.k.
€ 2.175/m²
9285SR Buitenpost
€ 600.000 k.k.
€ 2.777/m²
9285TT Buitenpost
€ 495.000 k.k.
€ 3.093/m²
9285KG Buitenpost
€ 479.000 k.k.
€ 2.443/m²
9285ST Buitenpost
€ 535.000 k.k.
€ 3.614/m²
9285PR Buitenpost
€ 295.000 k.k.
€ 2.681/m²
9285TL Buitenpost
€ 675.000 k.k.
€ 2.518/m²
9285PR Buitenpost
€ 325.000 k.k.
€ 3.282/m²
Bekijk recente verkopen en ontvang gratis offertes van lokale makelaars. Vergelijk meer dan 19 makelaars in Buitenpost.
Zelf je woning verkopen in Buitenpost? Vergelijk verkoopmakelaars in Buitenpost of bekijk de beste verkoopmakelaars in Buitenpost als referentie bij jouw keuze.
Makelaars maken scherpere voorstellen als ze weten dat je vergelijkt — vraag offertes aan voor verkoop of aankoop.
Short answers about housing prices, sold homes and comparing real estate agents in Buitenpost.
De kosten van een makelaar in Buitenpost verschillen per kantoor, woningtype en verkoopaanpak. In Buitenpost kun je 19 real estate agents vergelijken; bekijk daarom ook de makelaars in Buitenpost om tarieven, presentatie en lokale ervaring beter naast elkaar te zetten.
On this page we currently show 42 sold houses in Buitenpost from our selection. This helps you to better assess recent transactions and the local housing market.
Houses sold in Buitenpost give insight into asking prices, house types and neighborhoods where recent transactions have taken place. Compare this also with the current housing stock in Buitenpost to better understand the market.
You can use sold homes as a first market indication, but a local real estate agent can better take into account finishing, location, maintenance and current demand in Buitenpost.
Vergelijk de 19 real estate agents in Buitenpost op lokale verkoopervaring, reviews, verwachte opbrengst, courtage en marketingaanpak. Bekijk verkoopmakelaars in Buitenpost of de top 10 makelaars in Buitenpost om snel sterke kantoren te ontdekken.
View current location data on residents, WOZ development, housing stock, energy consumption, business activity and safety in Buitenpost. In 2025 were there 5.925 residents. The average WOZ value in 2025 is EUR 281.852.
These figures help to better assess and compare the housing stock in Buitenpost with recent sold homes. Orient yourself then on suitable top real estate agents in Buitenpost for sales advice in this region.
Residents
5.925
Last year: 2025
Average WOZ
EUR 281.852
Last year: 2025
Average income per person.
EUR 25.358
Source: AllNumbers
Crimes (current year)
142
Total registered
| Year | Residents |
|---|---|
| 2021 | 5.775 |
| 2022 | 5.795 |
| 2023 | 5.905 |
| 2024 | 5.940 |
| 2025 | 5.925 |
| Year | Average WOZ |
|---|---|
| 2021 | EUR 200.215 |
| 2022 | EUR 218.397 |
| 2023 | EUR 247.509 |
| 2024 | EUR 261.249 |
| 2025 | EUR 281.852 |
Hoger
1.100
Praktisch
1.160
Middelbaar
1.980
Europa
200
Nederland
5.380
Buiten Europa
355
Label C
706
Label A
546
Label B
484
Label D
318
Label G
217
Label E
194
Label F
143
Label A+++
38
Label A++
22
Label A+
20
Label A++++
16
Label A+++++
1
| Year | Gas (m3) | Electricity (kWh) |
|---|---|---|
| 2020 | 1.386 | 2.531 |
| 2021 | 1.569 | 2.613 |
| 2022 | 1.177 | 2.452 |
| 2023 | 986 | 2.389 |
| 2024 | 951 | 2.497 |
Hoekwoning
Gas: 942 • Electricity: 1.775
Huurwoning
Gas: 845 • Electricity: 1.831
Koopwoning
Gas: 1.074 • Electricity: 2.755
Appartement
Gas: 634 • Electricity: 1.331
Tussenwoning
Gas: 851 • Electricity: 1.811
Vrijstaande woning
Gas: 1.140 • Electricity: 2.999
Twee-onder-één-kap woning
Gas: 902 • Electricity: 2.519
Total number of company establishments: 645
| Period | Crimes |
|---|---|
| jan 2025 | 13 |
| jan 2026 | 19 |
| jul 2025 | 5 |
| jun 2025 | 10 |
| mei 2025 | 12 |
| mrt 2025 | 10 |
| nov 2024 | 13 |
| nov 2025 | 13 |
| okt 2024 | 7 |
| okt 2025 | 17 |
| sep 2024 | 11 |
| sep 2025 | 12 |
These figures give an indicative picture of safety trends in the living environment of Buitenpost.
Short answers based on current local statistics, handy for a quick comparison of the living environment.
Buitenpost telt in 2025 ongeveer 5.925 inwoners.
De gemiddelde WOZ-waarde in Buitenpost is in 2025 circa € 281.852.
Het gemiddelde inkomen per inwoner in Buitenpost ligt rond € 25.358 per jaar.
Voor het huidige jaar gaat het om ongeveer 142 geregistreerde misdrijven. Gebruik deze cijfers als indicatie en vergelijk trends per periode.
In Buitenpost komt vooral "Vrijstaande woningen" veel voor, met ongeveer 972 woningen.