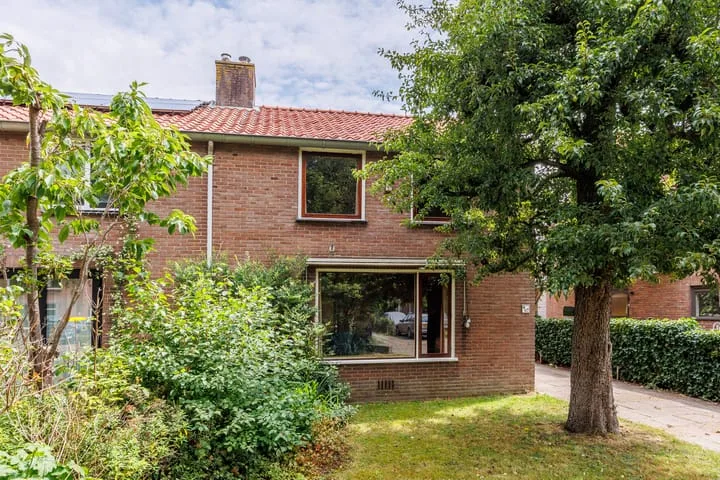
- Sold
Molenaarshoek 8
3981TM Bunnik
€ 635.000 k.k.
€ 4.774/m²
- Living area
- 133 m²
- Land area
- 290 m²
- Bedrooms
- 4
Searching in 63 houses in Bunnik
Type to search. Use arrow down and arrow up to navigate through results and press Enter to open.
Hidden search suggestions.
View current properties in Bunnik or search targeted on street, postal code and property characteristics.
View the current housing stock in Bunnik and quickly filter by price, living area, rooms and more. There are currently 63 houses in this place within our selection. View also 46 sold houses in Bunnik for extra insight into the local housing market.
3981TM Bunnik
€ 635.000 k.k.
€ 4.774/m²
3981AN Bunnik
€ 715.000 k.k.
€ 5.720/m²
3981AP Bunnik
€ 695.000 k.k.
€ 6.043/m²
3981TZ Bunnik
€ 645.000 k.k.
€ 6.028/m²
3981CG Bunnik
€ 500.000 k.k.
€ 5.813/m²
3981TK Bunnik
€ 725.000 k.k.
€ 5.330/m²
3981KJ Bunnik
€ 725.000 k.k.
€ 5.620/m²
Get free quotes from real estate agents with local market knowledge. Compare more than 198 real estate agents in Bunnik.
Selling a home in Bunnik? Compare all real estate agents in Bunnik or view the top 10 real estate agents in Bunnik for extra context for your choice.
Real estate agents make sharper offers when they know you're comparing — ask for quotes for sale or purchase.
Practical answers about housing supply, sales and comparing real estate agents in Bunnik.
The costs of a real estate agent in Bunnik depend on commission, setup costs, property presentation and the chosen service. Compare the 198 real estate agents in Bunnik via the real estate agent page and request multiple quotes to compare rates and approach well.
Within our selection, we are currently showing 63 houses in Bunnik. View also the sold houses in Bunnik to compare the current offering with recent transactions.
Take into account not only price and living area but also maintenance, energy label, location, outdoor space and sales status. This way you compare houses in Bunnik on more than just the asking price.
A local real estate agent knows the neighborhoods, recent transactions and demand in Bunnik. By comparing 198 real estate agents in the region you get a better insight into prices, sales strategy and expected yield; the top 10 in Bunnik provides a useful starting point.
Yes, when making a sales plan, a valuation in Bunnik is wise. You gain insight into a realistic asking price and can then compare offers from real estate agents specifically.
View current location data on residents, WOZ development, housing stock, energy consumption, business activity and safety in Bunnik. In 2025 were there 7.400 residents. The average WOZ value in 2025 is EUR 563.000.
These figures help to better assess and compare the housing stock in Bunnik with recent sold homes. Orient yourself then on suitable top real estate agents in Bunnik for sales advice in this region.
Residents
7.400
Last year: 2025
Average WOZ
EUR 563.000
Last year: 2025
Average income per person.
EUR 40.800
Source: AllNumbers
Crimes (current year)
320
Total registered
| Year | Residents |
|---|---|
| 2021 | 7.065 |
| 2022 | 7.140 |
| 2023 | 7.315 |
| 2024 | 7.350 |
| 2025 | 7.400 |
| Year | Average WOZ |
|---|---|
| 2021 | EUR 423.000 |
| 2022 | EUR 453.000 |
| 2023 | EUR 551.000 |
| 2024 | EUR 530.000 |
| 2025 | EUR 563.000 |
Hoger
2.980
Praktisch
660
Middelbaar
1.350
Europa
520
Nederland
5.965
Buiten Europa
910
Label C
994
Label A
578
Label B
407
Label D
392
Label F
341
Label E
214
Label G
213
Label A+++
91
Label A+
51
Label A++
44
Label A++++
6
Label A+++++
0
| Year | Gas (m3) | Electricity (kWh) |
|---|---|---|
| 2020 | 1.410 | 2.890 |
| 2021 | 1.580 | 2.960 |
| 2022 | 1.220 | 2.730 |
| 2023 | 1.010 | 2.590 |
| 2024 | 970 | 2.650 |
Hoekwoning
Gas: 1.160 • Electricity: 2.680
Huurwoning
Gas: 710 • Electricity: 2.000
Koopwoning
Gas: 1.130 • Electricity: 2.820
Appartement
Gas: 490 • Electricity: 1.890
Tussenwoning
Gas: 1.030 • Electricity: 2.490
Vrijstaande woning
Gas: 1.710 • Electricity: 4.010
Twee-onder-één-kap woning
Gas: 1.140 • Electricity: 2.900
Total number of company establishments: 1.330
| Period | Crimes |
|---|---|
| jan 2026 | 28 |
| jul 2025 | 35 |
| jun 2025 | 36 |
| mei 2025 | 35 |
| mrt 2025 | 27 |
| mrt 2026 | 22 |
| nov 2024 | 27 |
| nov 2025 | 22 |
| okt 2024 | 30 |
| okt 2025 | 23 |
| sep 2024 | 38 |
| sep 2025 | 21 |
These figures give an indicative picture of safety trends in the living environment of Bunnik.
Short answers based on current local statistics, handy for a quick comparison of the living environment.
Bunnik telt in 2025 ongeveer 7.400 inwoners.
De gemiddelde WOZ-waarde in Bunnik is in 2025 circa € 563.000.
Het gemiddelde inkomen per inwoner in Bunnik ligt rond € 40.800 per jaar.
Voor het huidige jaar gaat het om ongeveer 320 geregistreerde misdrijven. Gebruik deze cijfers als indicatie en vergelijk trends per periode.
In Bunnik komt vooral "Tussenwoningen" veel voor, met ongeveer 1.072 woningen.