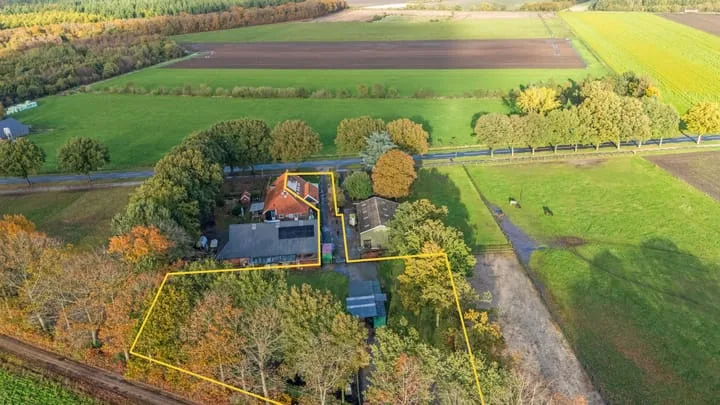
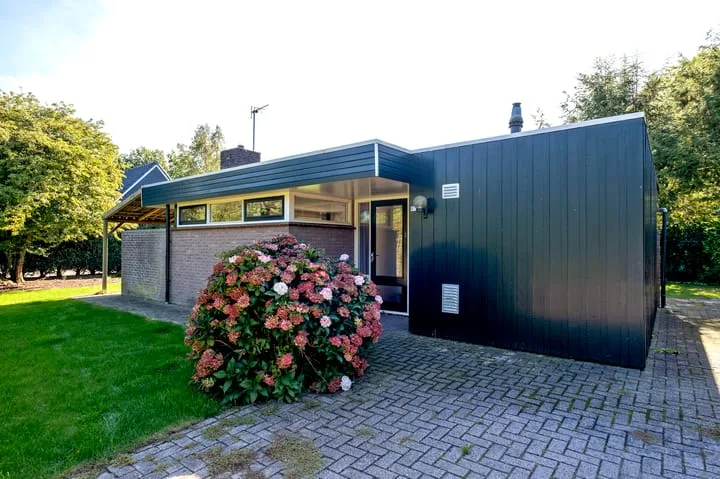
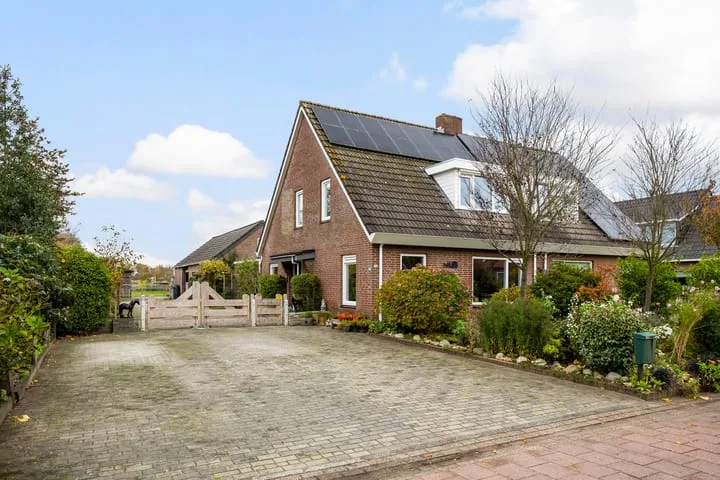
Houses sold in De Kiel

View 5 sold houses in De Kiel

Connected to: Vastgoed Nederland NVM Makelaars

On this page you will find recently sold homes in De Kiel. Use this overview to better estimate selling prices, popular neighborhoods, and the local housing supply before you choose a real estate agent. Also view the current housing supply with 10 houses in De Kiel.

Selection

Search and filter homes

Set your preferences and discover homes that suit you.

Total supply 240.836
Filters

Set price, area and other characteristics. Adjust a filter or click on Show homes. Location changes directly above.

Reset filters

You search for

  • Place De Kiel
  • Status Sold

Sell your house in De Kiel? Compare real estate agents

View recent sales and receive free quotes from local real estate agents. Compare more than 15 real estate agents in De Kiel.

Free request a quote

  • Quotes in De Kiel
  • Non-binding
  • Personal
  • Compare free rates

Selling your own home in De Kiel? Compare real estate agents in De Kiel or view the best real estate agents in De Kiel as a reference for your choice.

Compare multiple quotes

Real estate agents make sharper offers when they know you're comparing — ask for quotes for sale or purchase.

Frequently asked questions about sold homes in De Kiel

Short answers about housing prices, sold homes and comparing real estate agents in De Kiel.

Residential and neighborhood statistics in De Kiel

View current location data on residents, WOZ development, housing stock, energy consumption, business activity and safety in De Kiel. In 2026 were there 419 residents. The average WOZ value in 2025 is EUR 349.871.

These figures help to better assess and compare the housing stock in De Kiel with recent sold homes. Orient yourself then on suitable top real estate agents in De Kiel for sales advice in this region.

Residents

419

Last year: 2026

Average WOZ

EUR 349.871

Last year: 2025

Average income per person.

EUR 31.125

Source: AllNumbers

Crimes (current year)

3

Total registered

Demographics and WOZ development

Inhabitants per year

Inhabitants per year in De Kiel
Year Residents
2021 429
2022 438
2023 429
2024 414
2025 424
2026 419

Annual WOZ value

WOZ value per year in De Kiel
Year Average WOZ
2021 EUR 248.757
2022 EUR 280.810
2023 EUR 317.143
2024 EUR 332.592
2025 EUR 349.871

Composition of residents

Age build-up

65+: 113 0-15: 40 15-25: 44 25-45: 73 45-65: 141

Education level

Hoger

5

Praktisch

11

Middelbaar

175

Origin of residents (2025)

Europa

11

Nederland

400

Buiten Europa

12

Housing stock and construction periods

Types of homes

Appartementen 2
Vrijstaande woningen 126
Twee-onder-één-kap woningen 26

Construction period of buildings

Voor 1700 0
1700 tot 1900 0
1900 tot 1925 10
1925 tot 1950 40
1950 tot 1970 41
1970 tot 1980 65
1980 tot 1990 15
1990 tot 2000 22
2000 tot 2010 9
2010 tot 2020 2
2020 en later 1

Energy and sustainability

Energy label distribution

Label C

55

Label F

31

Label D

26

Label B

25

Label A

23

Label G

22

Label E

6

Label A+

0

Label A++

0

Label A+++

0

Label A++++

0

Label A+++++

0

Average energy consumption per year

Average energy consumption per year in De Kiel
Year Gas (m3) Electricity (kWh)
2020 1.559 3.276
2021 1.771 3.403
2022 1.400 3.190
2023 1.174 2.999
2024 1.124 3.040

Consumption per house type

Hoekwoning

Gas: 124 • Electricity: 214

Huurwoning

Gas: 820 • Electricity: 1.435

Koopwoning

Gas: 1.179 • Electricity: 3.148

Appartement

Gas: 77 • Electricity: 183

Tussenwoning

Gas: 107 • Electricity: 236

Vrijstaande woning

Gas: 1.205 • Electricity: 3.160

Twee-onder-één-kap woning

Gas: 797 • Electricity: 1.645

Business activity in De Kiel (2025)

Handel en HORECA 6
Nijverheid en energie 11
Zakelijke dienstverlening 21
Overheid, onderwijs en zorg 6
Landbouw, bosbouw en visserij 10
Vervoer, informatie en communicatie 0
Financiele diensten en onroerendgoed 0
Cultuur, recreatie en overige diensten 5

Total number of company establishments: 59

Recent crime statistics

Recent crime statistics in De Kiel
Period Crimes
jan 2026 0
jul 2025 1
jun 2025 0
mei 2025 1
mrt 2025 0
mrt 2026 0
nov 2024 2
nov 2025 0
okt 2024 0
okt 2025 1
sep 2024 0
sep 2025 0

These figures give an indicative picture of safety trends in the living environment of De Kiel.

Frequently asked questions about living in De Kiel

Short answers based on current local statistics, handy for a quick comparison of the living environment.

Hoeveel inwoners heeft De Kiel?

De Kiel telt in 2026 ongeveer 419 inwoners.

Wat is de gemiddelde WOZ-waarde in De Kiel?

De gemiddelde WOZ-waarde in De Kiel is in 2025 circa € 349.871.

Wat is het gemiddelde inkomen per inwoner in De Kiel?

Het gemiddelde inkomen per inwoner in De Kiel ligt rond € 31.125 per jaar.

Hoe veilig is wonen in De Kiel?

Voor het huidige jaar gaat het om ongeveer 3 geregistreerde misdrijven. Gebruik deze cijfers als indicatie en vergelijk trends per periode.

Welke woningtypen komen het meest voor in De Kiel?

In De Kiel komt vooral "Vrijstaande woningen" veel voor, met ongeveer 126 woningen.

Receive free, non-binding quotes

Compare multiple real estate agents and choose the best match.