Residents
1.089
Last year: 2026
6994CB De Steeg • Gelderland
€ 895.000 k.k.
Cost of copper (estimated): € 19.750
2% transfer tax (€ 17.900) + notary (€ 1.150) + valuation (€ 700)
Total incl. VAT: € 914.750
Purchase price /m²: € 3.714
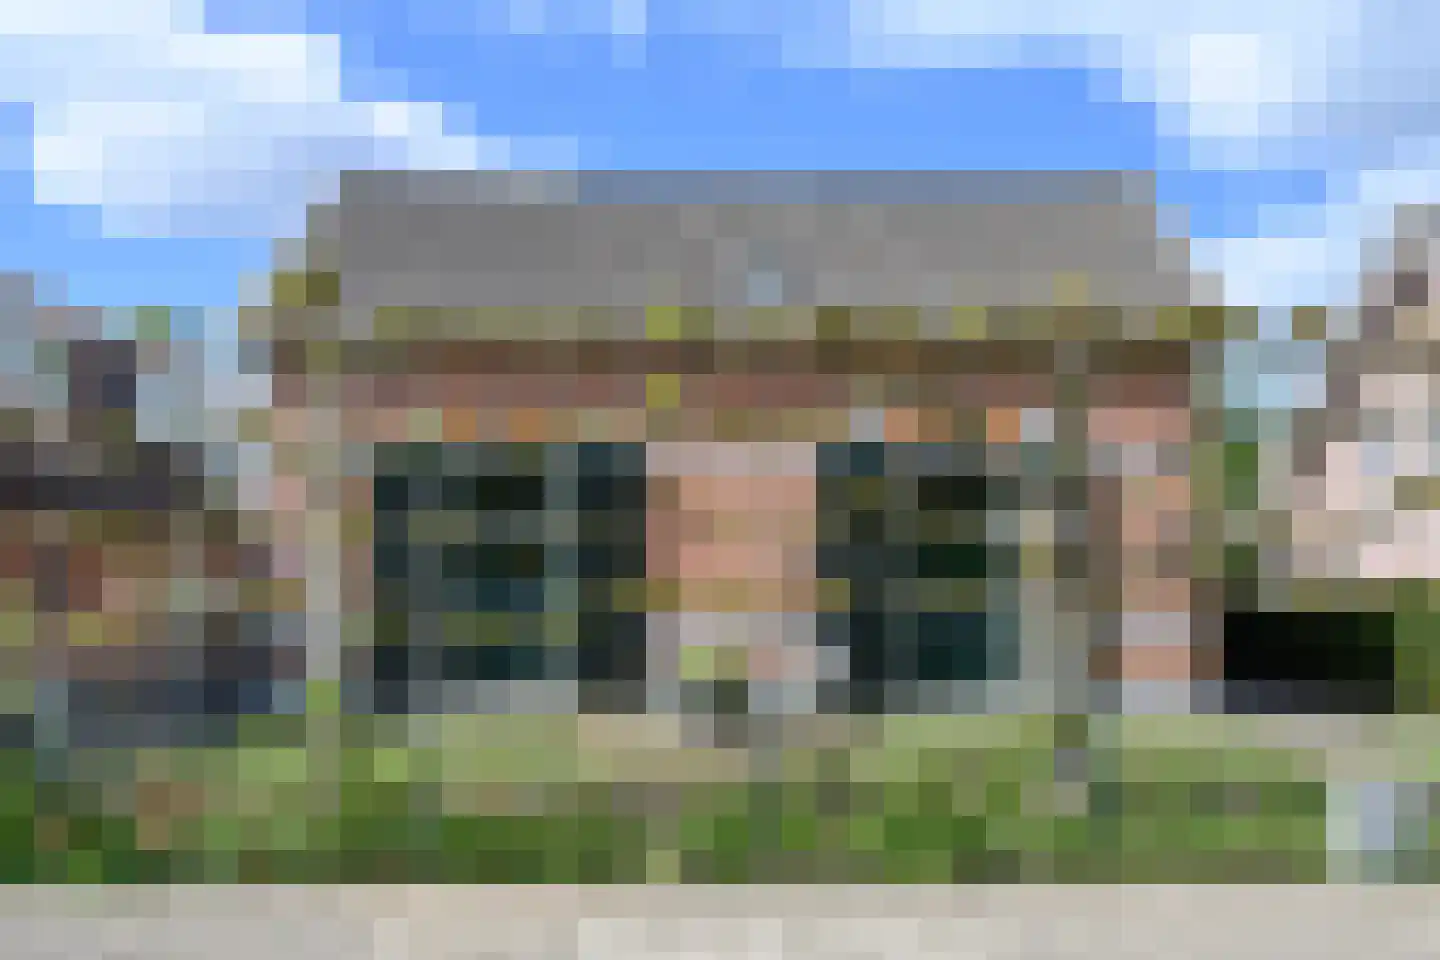
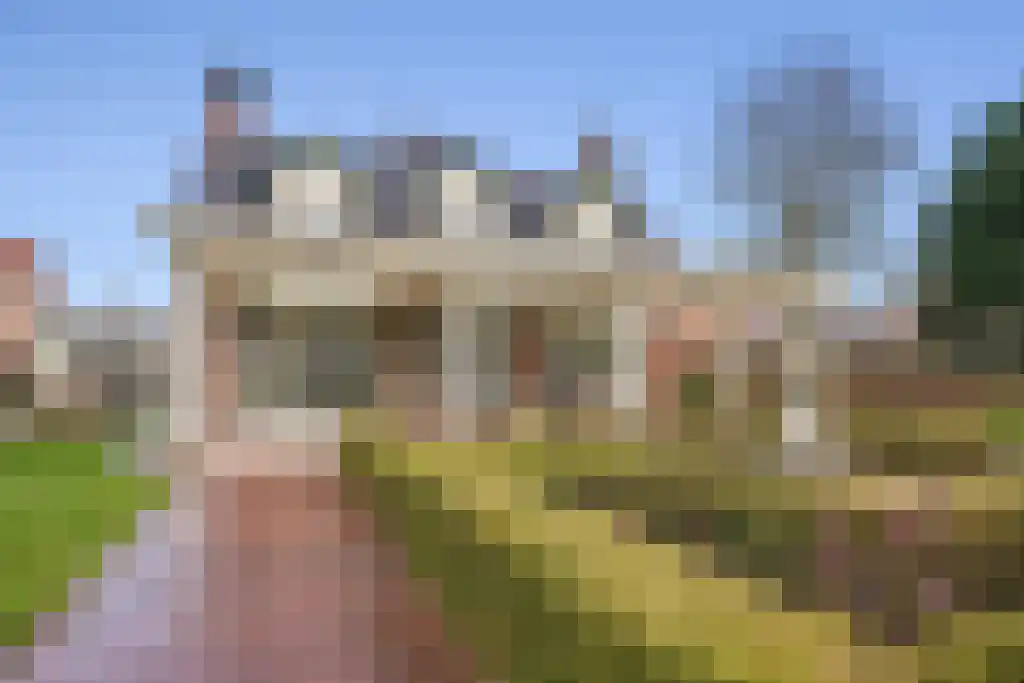
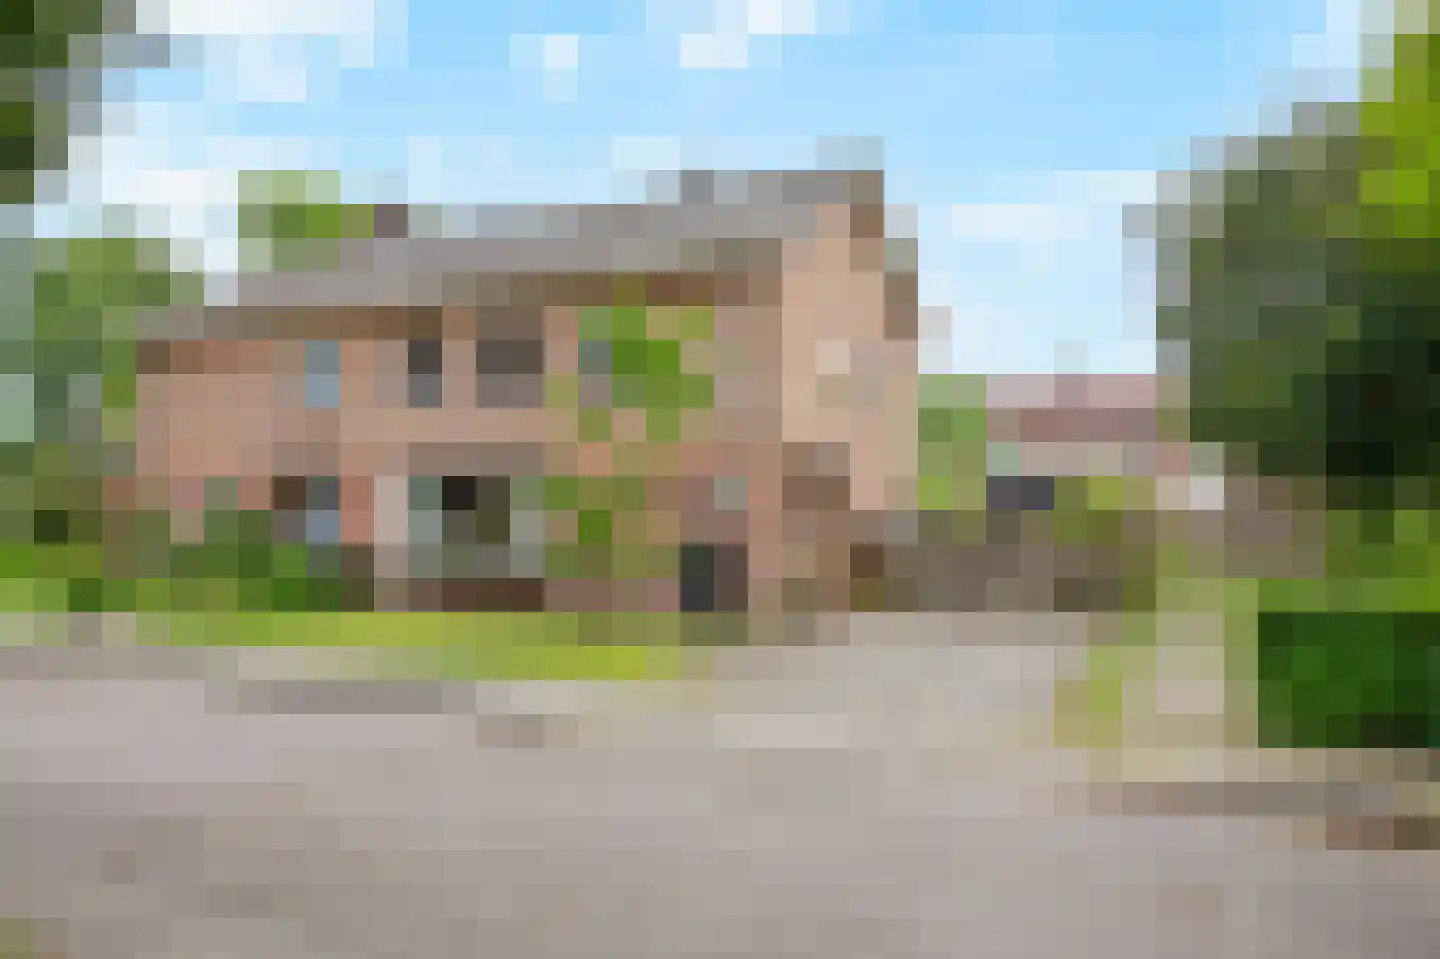
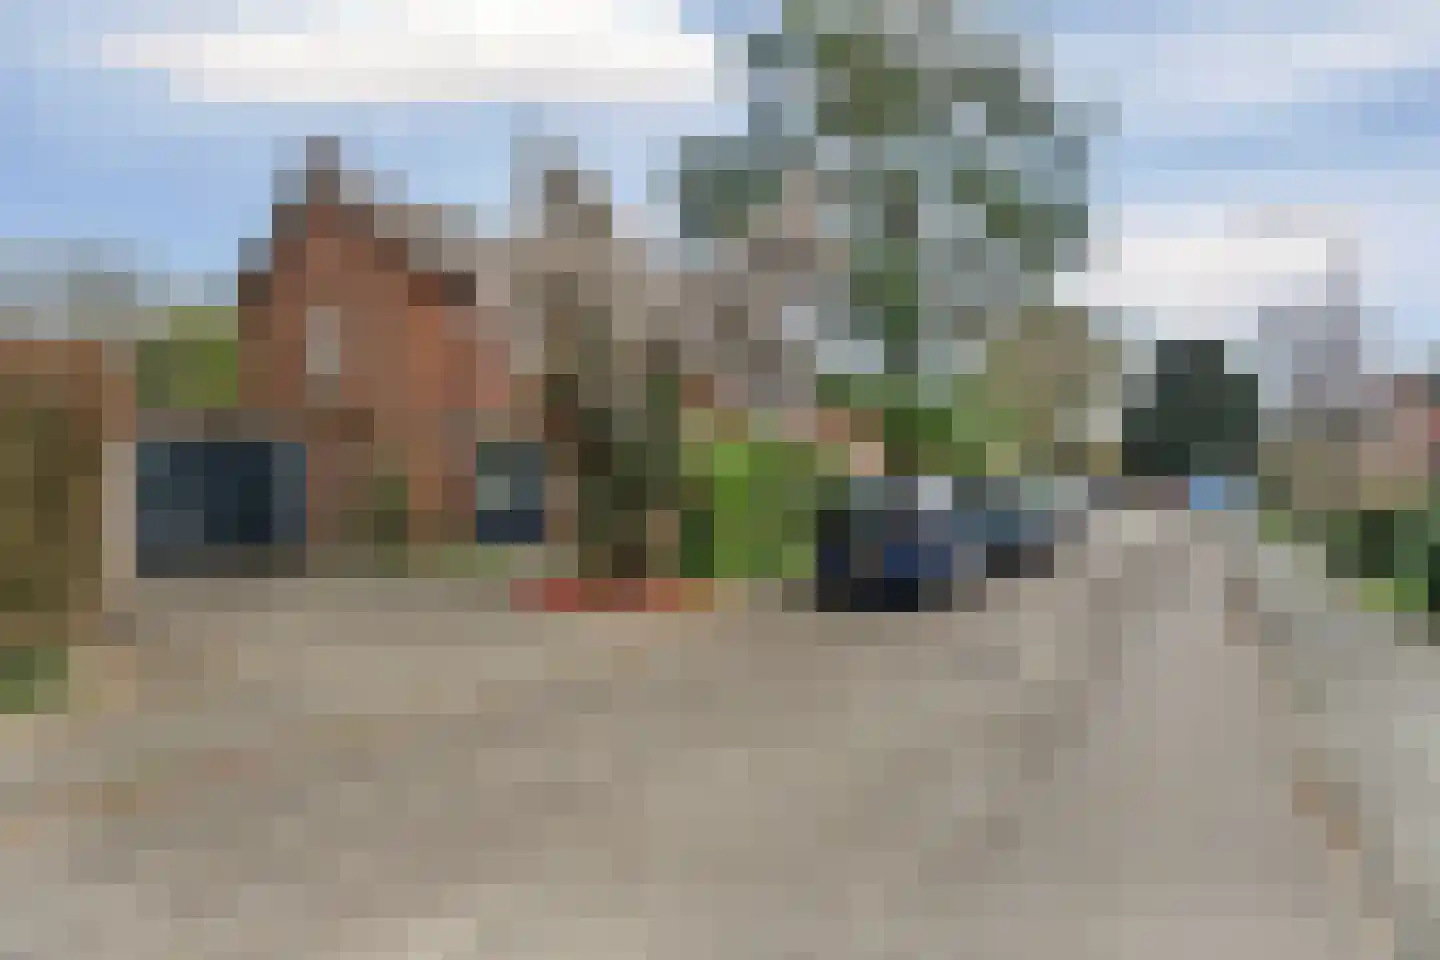
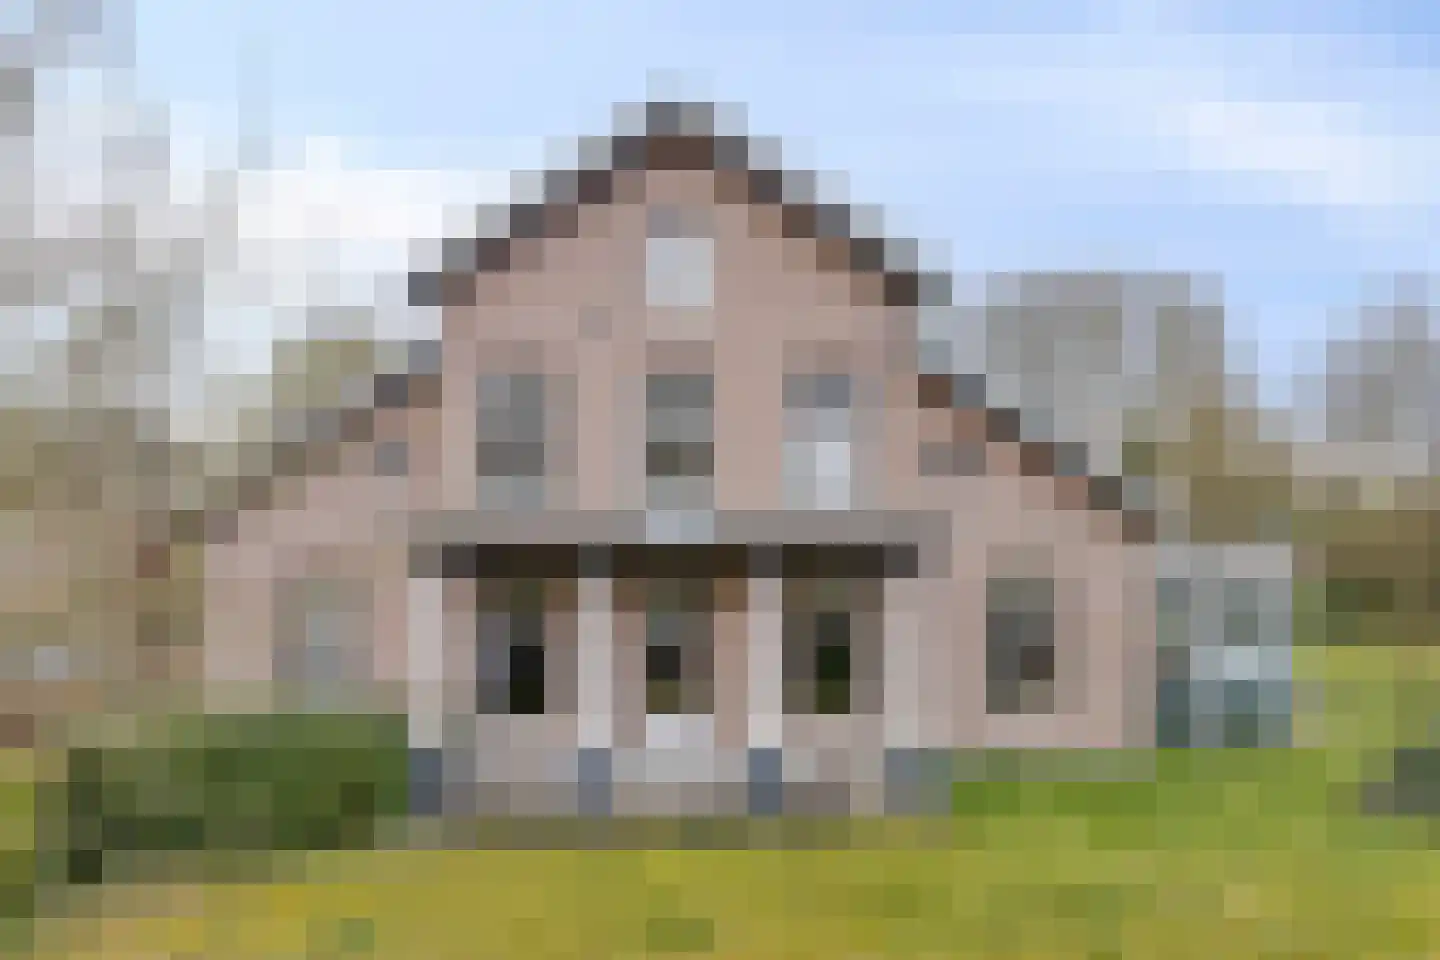
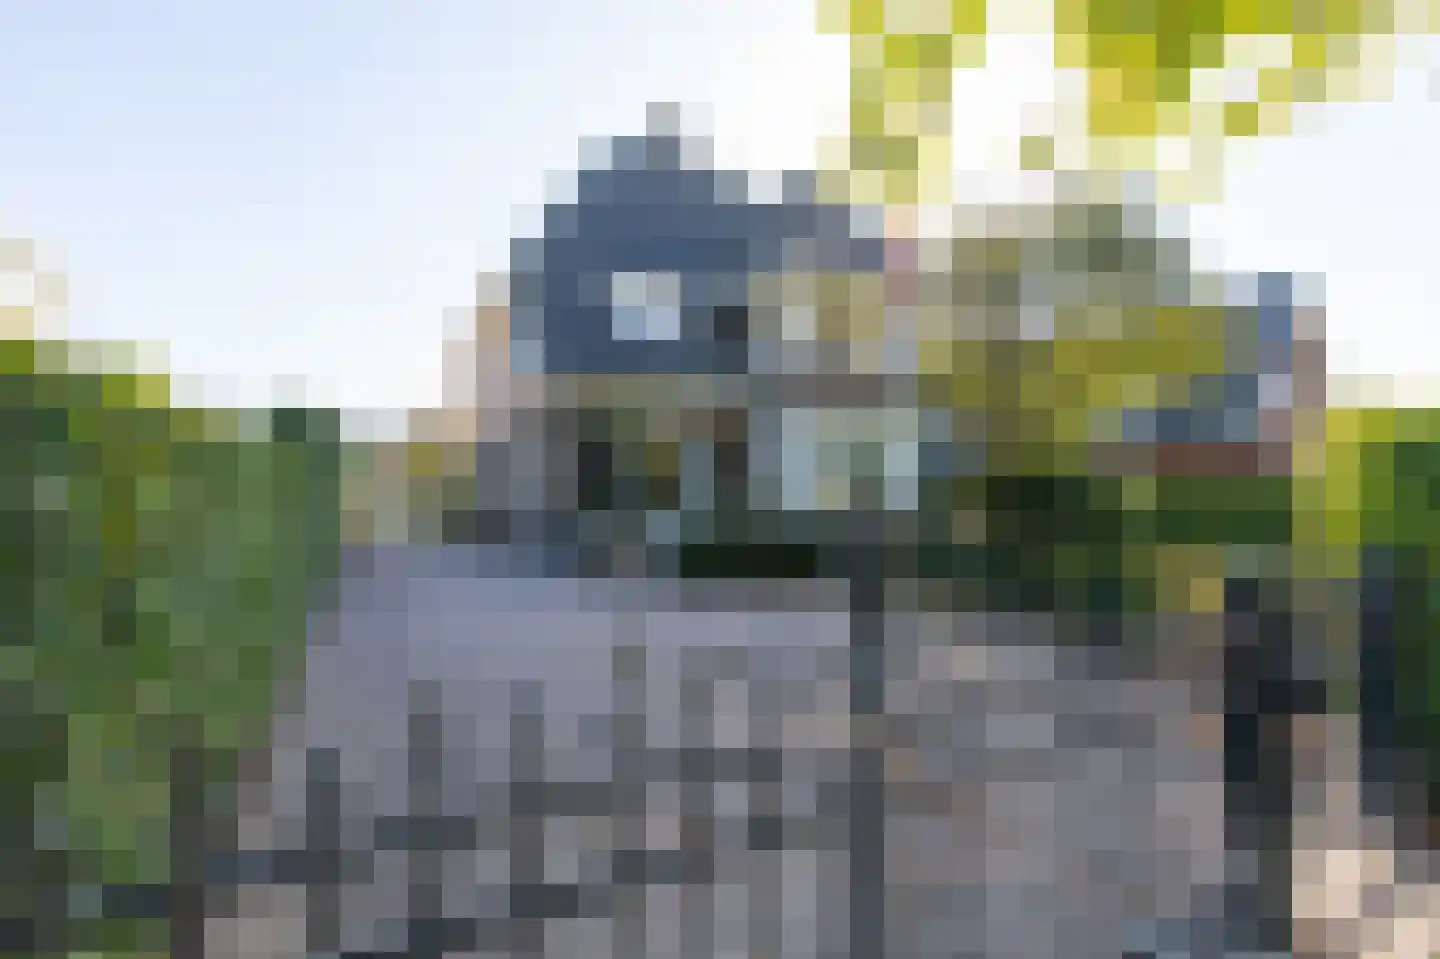
Charmante vrijstaande woning met karakter en mogelijkheid tot dubbele bewoning. Op een unieke locatie in De Steeg staat deze bijzondere, karakteristieke vrijstaande woning. Dankzij de mogelijkheid tot dubbele bewoning is dit het ideale huis voor gezinnen die samen willen wonen, voor werken aan huis of voor het creëren van een comfortabel woondeel voor ouders of (volwassen) kinderen. De hoofdwoning beschikt over een lichte woonkamer met grote raampartijen die zorgen voor een prachtige lichtinval. Aangrenzend vindt u een gezellige serre die een prachtig uitzicht biedt over de woning en de tuin. De moderne keuken is voorzien van hoogwaardige inbouwapparatuur. Op de bovenverdieping is een speelse loft gecreëerd, perfect om te ontspannen of te gebruiken voor hobby’s. De ruime, luxe afgewerkte master bedroom en de moderne badkamer met ligbad, grote douchecabine, dubbele wastafel en toilet maken deze woning compleet. Achter in de tuin staat een prachtig tuinhuis, ideaal voor hobby’s, ontspanning of gezellige bijeenkomsten met vrienden en familie. De tuin biedt volop privacy en sfeer. Het andere gedeelte van de woning is eveneens volledig zelfstandig en beschikt over een lichte woonkamer met aangrenzende keuken met inbouwapparatuur, een nette master bedroom, een extra slaapkamers en een moderne badkamer met douche en wastafel. Ook hier zorgen de grote raampartijen voor een fijne lichtinval. De woning heeft een eigen oprit met ruimte voor twee auto’s en biedt veel mogelijkheden dankzij de dubbele bewoning. Een ideale plek voor wie ruimte, licht en comfort zoekt, gecombineerd met een unieke locatie in De Steeg. Het volledige huis is voorzien geluidswerende ramen en dakisolatie gerealiseerd door Prorail. Het huidige energielabel is afgegeven voor de plaatsing van o.a. de zonnepanelen. In de toekomst zal er een geluidsscherm tegenover de woning worden geplaatst, meer informatie is beschikbaar bij de documentatie en bij de verkopend makelaar. Over De Steeg: De Steeg ligt ten oosten van Arnhem, tussen De IJssel en Nationaal Park Veluwezoom. Met de auto bent u binnen 20 minuten in Arnhem maar voor de dagelijkse boodschappen liggen Rheden (2 km) en Dieren (5 km) dichterbij. Met het openbaar vervoer is De Steeg goed bereikbaar. Het natuurgebied de Posbank (Nationaal Park De Veluwezoom) ligt op loopafstand van de woning. Voor dit woonhuis is een eigen website met o.a. fullscreen foto's beschikbaar. U vindt de website door straatnaam, huisnummer achter elkaar te typen en af te sluiten met .nl In het kader van eventuele vervolginteresse wijzen wij u op onderstaande voor deze woning van toepassing zijnde toevoegingen op de standaard NVM koopovereenkomst: - Ouderdomsclausule - Asbestclausule - Documentatie bij beroep op een eventueel opgenomen financieringsvoorbehoud. - Toelichting meetinstructie. - Aanvulling notariskeuze. Een nadere uitleg over mogelijke clausules/ toevoegingen treft u aan achterin de verkoopbrochure, te downloaden op de website van de woning.
€ 895.000
Cost of copper (estimated): € 19.750
2% transfer tax (€ 17.900) + notary (€ 1.150) + valuation (€ 700)
Total purchase (incl. p.p.): € 914.750
3,34%
Yearly
€ 44.750
Direct available
Estimated mortgage
Indicative gross monthly cost
Based on annuity and 30 year term
Indicative net monthly cost
iDisclaimer: this mortgage calculation is a simplified indication based on general assumptions. No rights can be derived from the results shown. Calculated with 10-annual interest (zonder NHG), automatically determined based on the price limit € 470.000. Source: 10-jaars rente uit mortgage_rates (15-06-2026 03:45). For non-NHG, an 80% mortgage of the market value has been used in this indication.
Inloopdouche, wastafel, douche, dubbele wastafel, ligbad, toilet, en wastafelmeubel
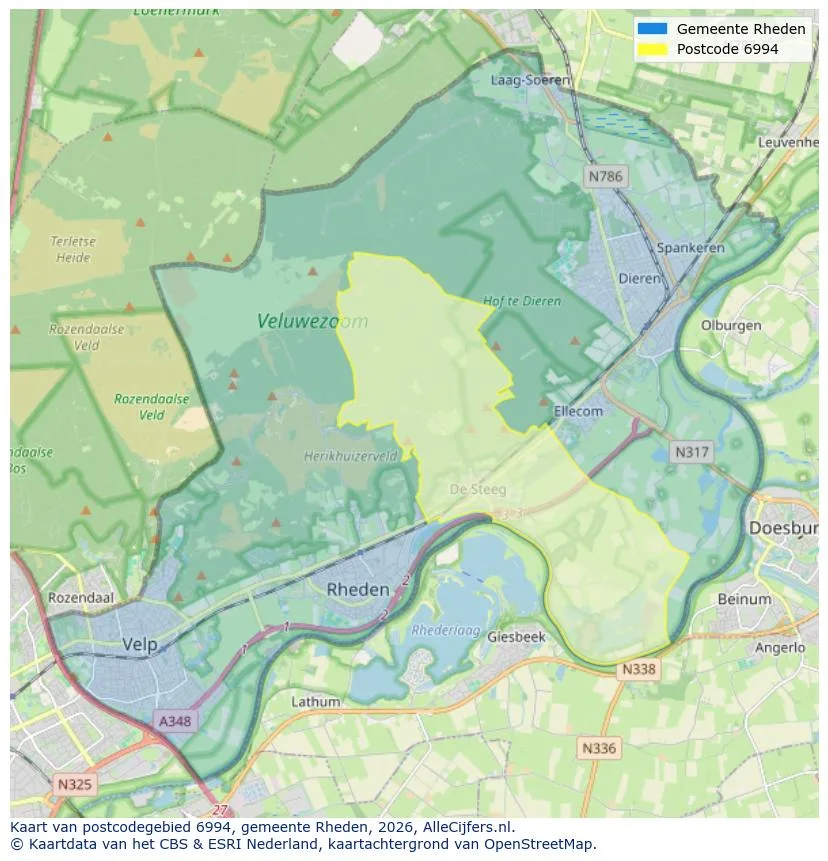
Explore De Steeg and the surrounding areas
View current location data on residents, WOZ development, housing stock, energy consumption, business activity and safety in De Steeg. In 2026 were there 1.089 residents. The average WOZ value in 2025 is EUR 433.814.
Residents
1.089
Last year: 2026
Average WOZ
EUR 433.814
Last year: 2025
Average income per person.
EUR 33.838
Source: AllNumbers
Crimes (current year)
27
Total registered
| Year | Residents |
|---|---|
| 2021 | 1.090 |
| 2022 | 1.085 |
| 2023 | 1.090 |
| 2024 | 1.080 |
| 2025 | 1.085 |
| 2026 | 1.089 |
| Year | Average WOZ |
|---|---|
| 2021 | EUR 293.827 |
| 2022 | EUR 325.418 |
| 2023 | EUR 391.495 |
| 2024 | EUR 419.118 |
| 2025 | EUR 433.814 |
Hoger
350
Praktisch
160
Middelbaar
260
Europa
50
Nederland
950
Buiten Europa
80
Label G
157
Label C
102
Label D
74
Label F
50
Label B
40
Label A
37
Label E
23
Label A++++
5
Label A+++
4
Label A+
2
Label A++
1
Label A+++++
0
| Year | Gas (m3) | Electricity (kWh) |
|---|---|---|
| 2020 | 1.643 | 3.250 |
| 2021 | 1.846 | 3.343 |
| 2022 | 1.441 | 3.175 |
| 2023 | 1.181 | 2.890 |
| 2024 | 1.178 | 3.029 |
Hoekwoning
Gas: 1.059 • Electricity: 2.312
Huurwoning
Gas: 964 • Electricity: 2.077
Koopwoning
Gas: 1.277 • Electricity: 3.326
Appartement
Gas: 608 • Electricity: 2.174
Tussenwoning
Gas: 912 • Electricity: 2.072
Vrijstaande woning
Gas: 1.518 • Electricity: 3.990
Twee-onder-één-kap woning
Gas: 1.166 • Electricity: 2.635
Total number of company establishments: 210
| Period | Crimes |
|---|---|
| jan 2026 | 3 |
| jul 2025 | 2 |
| jun 2025 | 1 |
| mei 2025 | 1 |
| mrt 2025 | 0 |
| mrt 2026 | 0 |
| nov 2024 | 2 |
| nov 2025 | 2 |
| okt 2024 | 0 |
| okt 2025 | 3 |
| sep 2024 | 1 |
| sep 2025 | 5 |
These figures give an indicative picture of safety trends in the living environment of De Steeg.
Short answers based on current local statistics, handy for a quick comparison of the living environment.
De Steeg telt in 2026 ongeveer 1.089 inwoners.
De gemiddelde WOZ-waarde in De Steeg is in 2025 circa € 433.814.
Het gemiddelde inkomen per inwoner in De Steeg ligt rond € 33.838 per jaar.
Voor het huidige jaar gaat het om ongeveer 27 geregistreerde misdrijven. Gebruik deze cijfers als indicatie en vergelijk trends per periode.
In De Steeg komt vooral "Twee-onder-één-kap woningen" veel voor, met ongeveer 172 woningen.
View more homes in this location.
6994JD De Steeg
€ 3.900 p/m
€ 8/m²
6994CM De Steeg
€ 425.000 k.k.
€ 4.167/m²
6994AM De Steeg
€ 399.000 k.k.
€ 3.531/m²
6994AE De Steeg
€ 1.300.000 k.k.
€ 1.410/m²

6994CP De Steeg
€ 695.000 k.k.
€ 4.964/m²
6994CP De Steeg
€ 1.295.000 k.k.
€ 5.860/m²

6994AK De Steeg
€ 675.000 k.k.
€ 3.461/m²

6994BD De Steeg
€ 375.000 k.k.
€ 2.757/m²
