
Residents
1.735
Last year: 2025
3258AG Den Bommel • Zuid-Holland

Emmastraat 47 in Den Bommel is een ruime vrijstaande woning met sfeervolle serre, tuin en diepe garage voor twee auto's. De woning heeft een oppervlakte van ongeveer 147 m² en wordt verlicht door 10 zonnepanelen. De inrichting telt woonkamer, keuken met L-vormige opstelling en eetbarretje, drie slaapkamers, badkamer met inloopdouche en zolderruimte. Het buitenbereik omvat borders, gazon en een theehuis, terwijl de garage is voorzien van oplaadpunt en omvormer. Den Bommel biedt rustige omgeving met toegang tot natuurlijke landschappen en strand aan het Haringvliet, binnen gemakkelijke reisafstand van Rotterdam of Breda.
€ 550.000
Cost of copper (estimated): € 12.850
2% transfer tax (€ 11.000) + notary (€ 1.150) + valuation (€ 700)
Total purchase (incl. p.p.): € 562.850
3,04%
Yearly
€ 27.500
Direct available
Estimated mortgage
Indicative gross monthly cost
Based on annuity and 30 year term
Indicative net monthly cost
iDisclaimer: this mortgage calculation is a simplified indication based on general assumptions. No rights can be derived from the results shown. Calculated with 10-annual interest (zonder NHG), automatically determined based on the price limit € 470.000. Source: 10-jaars rente uit mortgage_rates (05-05-2026 03:45). For non-NHG, an 80% mortgage of the market value has been used in this indication.
Douche, toilet, en wastafelmeubel
Elektra
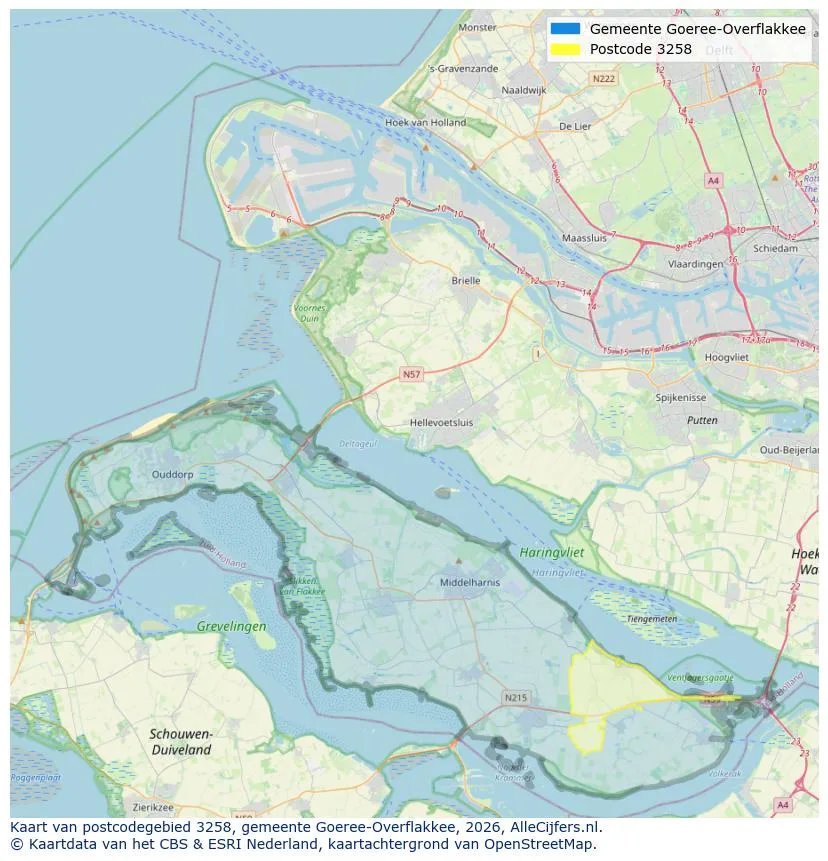
Discover where agents are active in Den Bommel
View current location data on residents, WOZ development, housing stock, energy consumption, business activity and safety in Den Bommel. In 2025 were there 1.735 residents. The average WOZ value in 2025 is EUR 318.000.
Residents
1.735
Last year: 2025
Average WOZ
EUR 318.000
Last year: 2025
Average income per person.
EUR 32.300
Source: AllNumbers
Crimes (current year)
31
Total registered
| Year | Residents |
|---|---|
| 2021 | 1.705 |
| 2022 | 1.715 |
| 2023 | 1.720 |
| 2024 | 1.735 |
| 2025 | 1.735 |
| Year | Average WOZ |
|---|---|
| 2021 | EUR 222.000 |
| 2022 | EUR 247.000 |
| 2023 | EUR 295.000 |
| 2024 | EUR 306.000 |
| 2025 | EUR 318.000 |
Hoger
250
Praktisch
440
Middelbaar
670
Europa
75
Nederland
1.550
Buiten Europa
110
Label A
161
Label C
156
Label G
137
Label B
111
Label F
73
Label D
71
Label E
31
Label A+
9
Label A++
4
Label A+++
3
Label A++++
0
Label A+++++
0
| Year | Gas (m3) | Electricity (kWh) |
|---|---|---|
| 2020 | 1.280 | 3.020 |
| 2021 | 1.410 | 3.040 |
| 2022 | 1.080 | 2.850 |
| 2023 | 900 | 2.710 |
| 2024 | 900 | 2.860 |
Hoekwoning
Gas: 820 • Electricity: 2.340
Huurwoning
Gas: 730 • Electricity: 2.010
Koopwoning
Gas: 990 • Electricity: 3.060
Appartement
Gas: 600 • Electricity: 1.950
Tussenwoning
Gas: 710 • Electricity: 2.250
Vrijstaande woning
Gas: 1.220 • Electricity: 3.580
Twee-onder-één-kap woning
Gas: 910 • Electricity: 2.800
Total number of company establishments: 230
| Period | Crimes |
|---|---|
| jan 2025 | 4 |
| jan 2026 | 0 |
| jul 2025 | 3 |
| jun 2025 | 2 |
| mei 2025 | 4 |
| mrt 2025 | 1 |
| nov 2024 | 7 |
| nov 2025 | 3 |
| okt 2024 | 3 |
| okt 2025 | 2 |
| sep 2024 | 2 |
| sep 2025 | 2 |
These figures give an indicative picture of safety trends in the living environment of Den Bommel.
Short answers based on current local statistics, handy for a quick comparison of the living environment.
Den Bommel telt in 2025 ongeveer 1.735 inwoners.
De gemiddelde WOZ-waarde in Den Bommel is in 2025 circa € 318.000.
Het gemiddelde inkomen per inwoner in Den Bommel ligt rond € 32.300 per jaar.
Voor het huidige jaar gaat het om ongeveer 31 geregistreerde misdrijven. Gebruik deze cijfers als indicatie en vergelijk trends per periode.
In Den Bommel komt vooral "Vrijstaande woningen" veel voor, met ongeveer 218 woningen.
View more homes in this location.
3258LM Den Bommel
€ 295.000 k.k.
€ 4.538/m²
3258BA Den Bommel
€ 342.500 k.k.

3258AD Den Bommel
€ 400.000 k.k.
€ 4.000/m²

3258LN Den Bommel
€ 975.000 k.k.
€ 6.866/m²

3258LM Den Bommel
€ 750.000 k.k.
€ 5.769/m²

3258AJ Den Bommel
Price upon request

3258BL Den Bommel
€ 345.000 k.k.
€ 2.875/m²

3258AN Den Bommel
€ 265.000 k.k.
€ 3.732/m²
