
Residents
17.649
Last year: 2026
6941ZB Didam • Gelderland
€ 519.000 k.k.
Cost of copper (estimated): € 12.230
2% transfer tax (€ 10.380) + notary (€ 1.150) + valuation (€ 700)
Total incl. VAT: € 531.230
Purchase price /m²: € 2.899
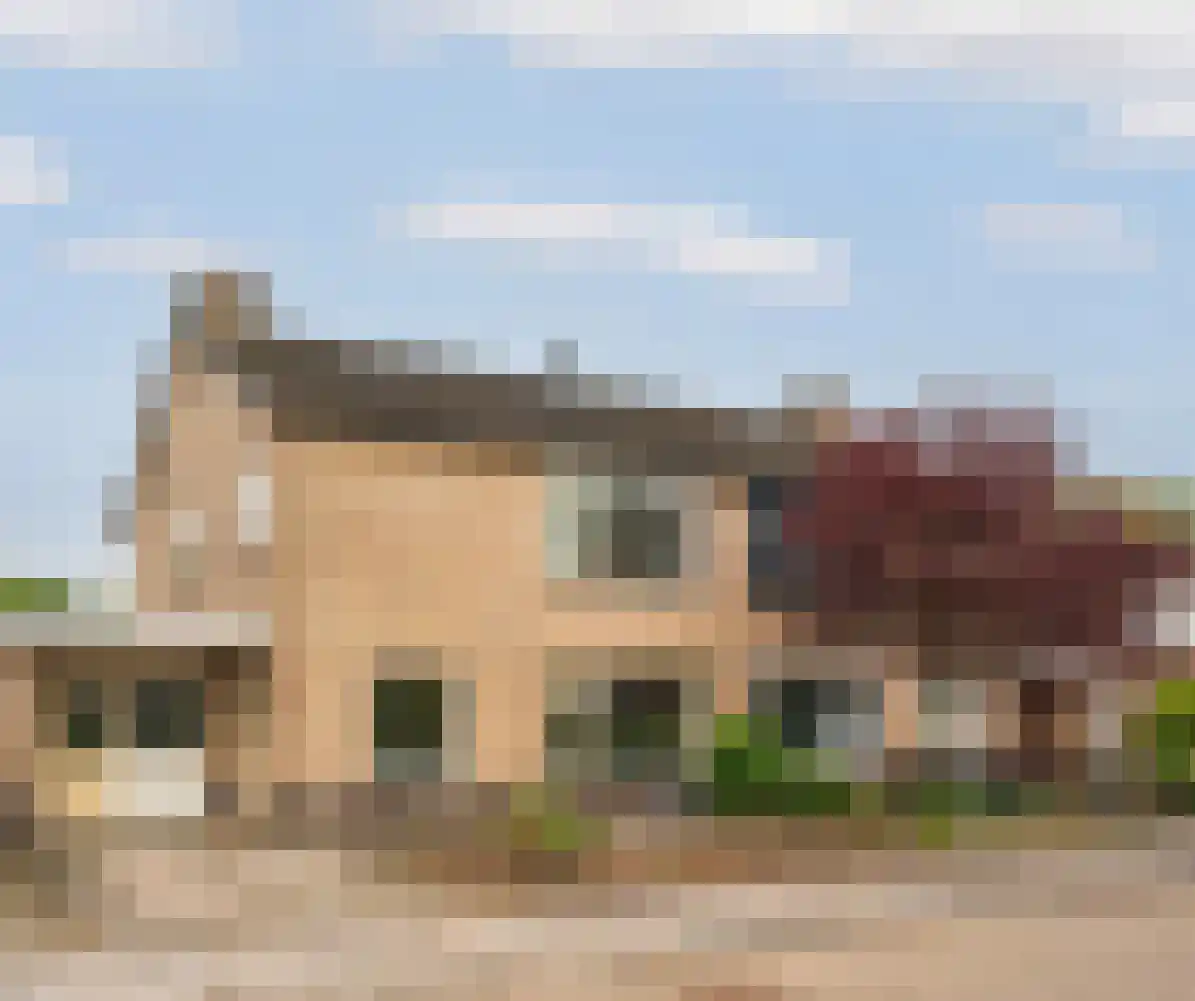
Ben je op zoek naar een royaal, vrijstaand woonhuis met een multi-functioneel bijgebouw? Deze woning is in 2024/2025 van top tot teen aangepakt dus zoek niet verder! De Beuk 79 in Didam is de kans waar jij op wachtte. Hier hoef je werkelijk alleen nog maar je verhuisdozen uit te pakken. Met een woonoppervlakte van maar liefst 179 m² en een slimme indeling, is dit het ideale familiehuis waar iedereen zijn eigen plekje vindt. De woning ligt in een rustige kindvriendelijke woonwijk op een fijne locatie in Didam. De dagelijkse voorzieningen zijn binnen handbereik. De woning ligt op korte afstand van het centrum. Hier vind je winkels, supermarkten en diverse voorzieningen. Ook scholen en kinderopvang liggen dichtbij, wat deze locatie geschikt maakt voor gezinnen. Het treinstation bereik je binnen enkele minuten fietsen. Daarnaast zorgen goede uitvalswegen voor een snelle verbinding richting de A12 en de A18. Indeling Begane grond: entree toegang naar de kelder en de lichte woonkamer met houtkachel. De keuken sluit direct aan op de woonkamer. De keuken beschikt over de benodigde inbouwapparatuur, de inductiekookplaat, combi-oven en radiator zijn vernieuwd in 2024. Aansluitend vindt u de praktische bijkeuken met achteringang, meterkast, de witgoedaansluitingen en het toilet met fontein. Eerste verdieping: Op de overloop heeft u toegang tot drie slaapkamers. Eén slaapkamer heeft een balkon. De moderne badkamer biedt veel comfort en is voorzien van een toilet, ligbad, inloopdouche, dubbele wastafel en elektrische vloerverwarming. Tweede verdieping: De zolder is volledig gerenoveerd en goed geïsoleerd. U vindt hier de CV-ketel en een dakkapel met kunststof kozijn met HR++glas, wat zorgt voor extra ruimte en licht. Dit is nu één slaapkamer maar kan met gemak gedeeld worden naar twee slaapkamers. Bijgebouw Het geïsoleerde bijgebouw biedt extra mogelijkheden als praktijkruimte of voor een logé. U beschikt hier over een eenvoudige keukenvoorziening, badkamer, CV-ketel en meterkast. Aansluitend overkapping voor de fietsen. Algemeen Bouwjaar: 1978; Energielabel: B; Woonoppervlakte: 179 m²; (inclusief bijgebouw) Inhoud: 686 m³; Perceeloppervlakte: 309 m². Bijzonderheden CV-ketel Vaillant, bouwjaar 2024; Vloerverwarming woonkamer; 18 zonnepanelen; Badkamer 2025; Garage in 2016 verbouwd tot gastenverblijf/praktijkruimte; Laadpaal aanwezig voor elektrische auto; Gezinswoning in fijne rustige wijk; Aanvaarding in overleg. Interesse in dit huis? Schakel direct je eigen NVM-aankoopmakelaar in. Je NVM-aankoopmakelaar behartigt jouw belangen en bespaart je tijd en zorgen. Adressen van collega NVM-aankoopmakelaars vind je op Funda.
€ 519.000
Cost of copper (estimated): € 12.230
2% transfer tax (€ 10.380) + notary (€ 1.150) + valuation (€ 700)
Total purchase (incl. p.p.): € 531.230
3,21%
Yearly
€ 25.950
Direct available
Estimated mortgage
Indicative gross monthly cost
Based on annuity and 30 year term
Indicative net monthly cost
iDisclaimer: this mortgage calculation is a simplified indication based on general assumptions. No rights can be derived from the results shown. Calculated with 10-annual interest (zonder NHG), automatically determined based on the price limit € 470.000. Source: 10-jaars rente uit mortgage_rates (08-06-2026 03:45). For non-NHG, an 80% mortgage of the market value has been used in this indication.
Dubbele wastafel, inloopdouche, ligbad, en toilet
Elektra, verwarming en stromend water
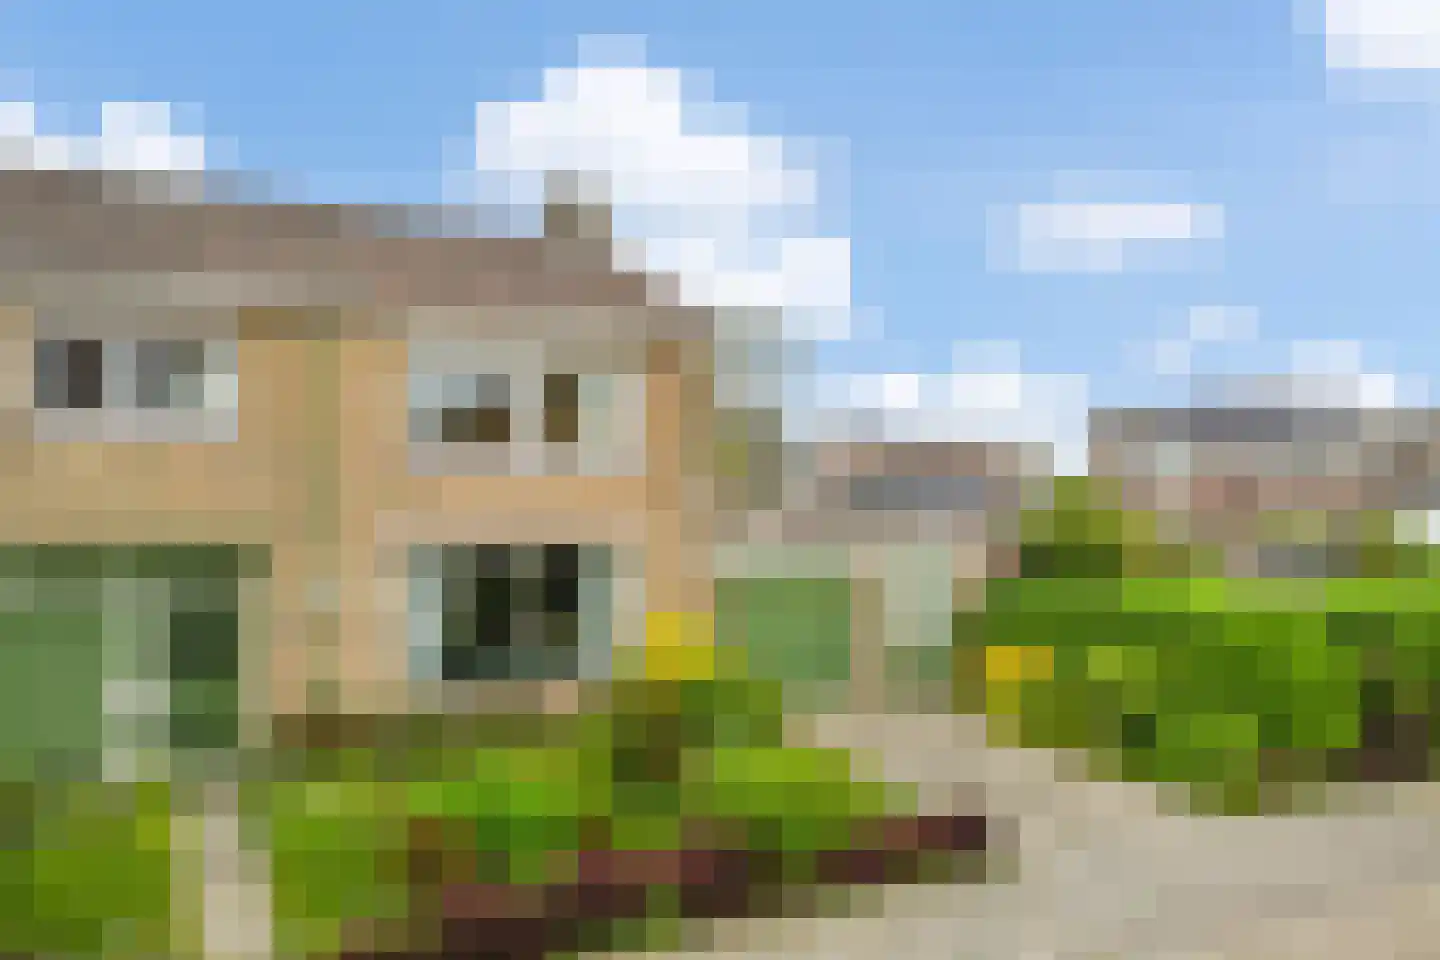
Geographic orientation and real estate agent density in Didam
View current location data on residents, WOZ development, housing stock, energy consumption, business activity and safety in Didam. In 2026 were there 17.649 residents. The average WOZ value in 2025 is EUR 327.000.
Residents
17.649
Last year: 2026
Average WOZ
EUR 327.000
Last year: 2025
Average income per person.
EUR 32.600
Source: AllNumbers
Crimes (current year)
309
Total registered
| Year | Residents |
|---|---|
| 2021 | 16.960 |
| 2022 | 17.185 |
| 2023 | 17.390 |
| 2024 | 17.445 |
| 2025 | 17.535 |
| 2026 | 17.649 |
| Year | Average WOZ |
|---|---|
| 2021 | EUR 236.000 |
| 2022 | EUR 257.000 |
| 2023 | EUR 286.000 |
| 2024 | EUR 300.000 |
| 2025 | EUR 327.000 |
Hoger
3.180
Praktisch
3.790
Middelbaar
5.970
Europa
975
Nederland
15.385
Buiten Europa
1.175
Label C
1.883
Label A
1.784
Label B
1.343
Label D
839
Label F
481
Label G
430
Label A+++
300
Label E
227
Label A++
148
Label A+
137
Label A++++
102
Label A+++++
0
| Year | Gas (m3) | Electricity (kWh) |
|---|---|---|
| 2020 | 1.330 | 3.140 |
| 2021 | 1.490 | 3.170 |
| 2022 | 1.160 | 2.980 |
| 2023 | 930 | 2.870 |
| 2024 | 880 | 2.960 |
Hoekwoning
Gas: 870 • Electricity: 2.580
Huurwoning
Gas: 700 • Electricity: 2.060
Koopwoning
Gas: 1.050 • Electricity: 3.300
Appartement
Gas: 610 • Electricity: 2.100
Tussenwoning
Gas: 800 • Electricity: 2.390
Vrijstaande woning
Gas: 1.270 • Electricity: 3.910
Twee-onder-één-kap woning
Gas: 950 • Electricity: 3.020
Total number of company establishments: 1.935
| Period | Crimes |
|---|---|
| jan 2026 | 21 |
| jul 2025 | 13 |
| jun 2025 | 25 |
| mei 2025 | 30 |
| mrt 2025 | 27 |
| mrt 2026 | 27 |
| nov 2024 | 39 |
| nov 2025 | 20 |
| okt 2024 | 39 |
| okt 2025 | 30 |
| sep 2024 | 20 |
| sep 2025 | 22 |
These figures give an indicative picture of safety trends in the living environment of Didam.
Short answers based on current local statistics, handy for a quick comparison of the living environment.
Didam telt in 2026 ongeveer 17.649 inwoners.
De gemiddelde WOZ-waarde in Didam is in 2025 circa € 327.000.
Het gemiddelde inkomen per inwoner in Didam ligt rond € 32.600 per jaar.
Voor het huidige jaar gaat het om ongeveer 309 geregistreerde misdrijven. Gebruik deze cijfers als indicatie en vergelijk trends per periode.
In Didam komt vooral "Vrijstaande woningen" veel voor, met ongeveer 2.019 woningen.
View more homes in this location.
6942KX Didam
€ 325.000 k.k.
€ 4.167/m²
6942KK Didam
€ 375.000 k.k.
€ 3.289/m²

6942XK Didam
€ 300.000 k.k.
€ 3.371/m²

6941AS Didam
€ 385.000 k.k.
€ 4.583/m²
6942DP Didam
€ 310.000 k.k.
€ 2.897/m²

6941CB Didam
€ 495.000 k.k.
€ 2.578/m²

6941AS Didam
€ 350.000 k.k.
€ 3.846/m²
6941BL Didam
€ 479.000 k.k.
€ 2.801/m²
