Residents
249.873
Last year: 2026
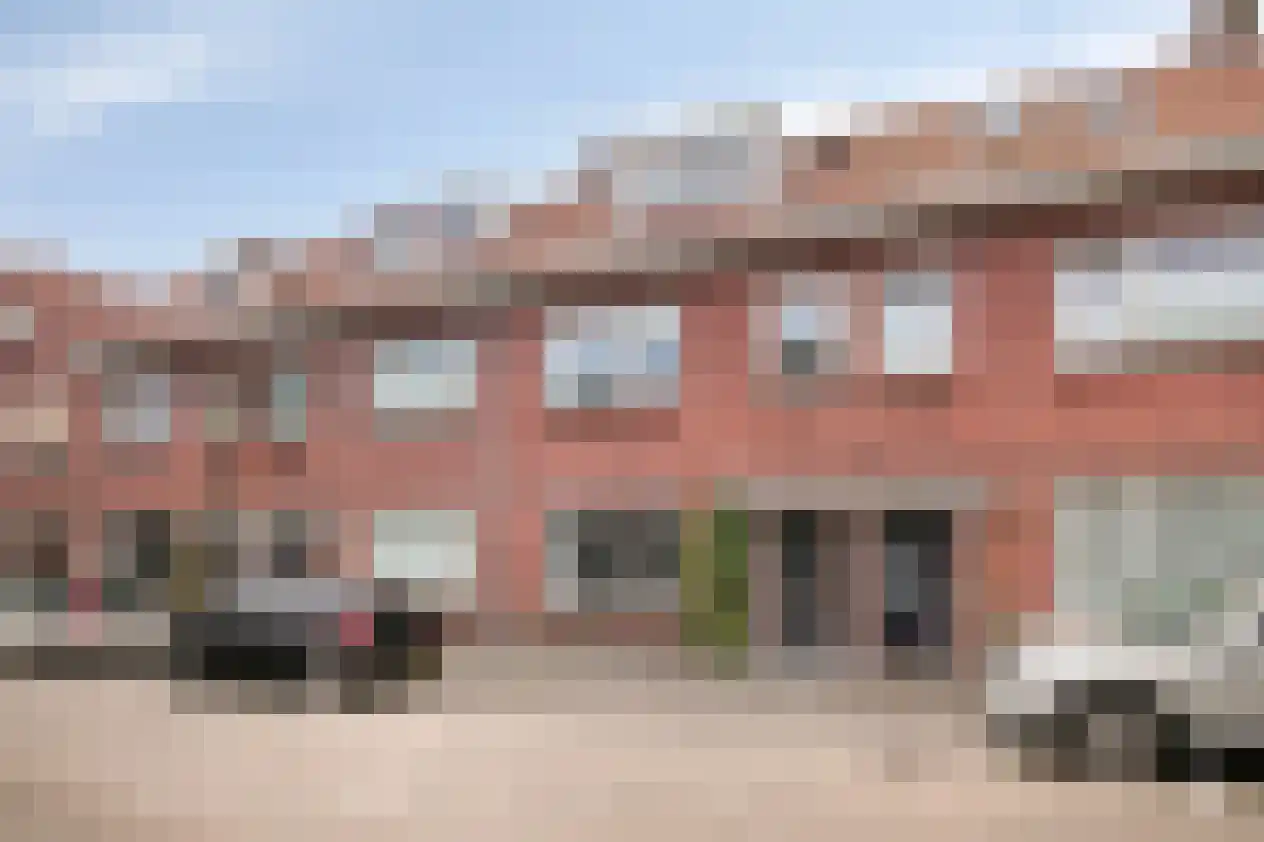
5644KE Eindhoven • Noord-Brabant
€ 485.000 k.k.
Cost of copper (estimated): € 11.550
2% transfer tax (€ 9.700) + notary (€ 1.150) + valuation (€ 700)
Total incl. VAT: € 496.550
Purchase price /m²: € 4.076
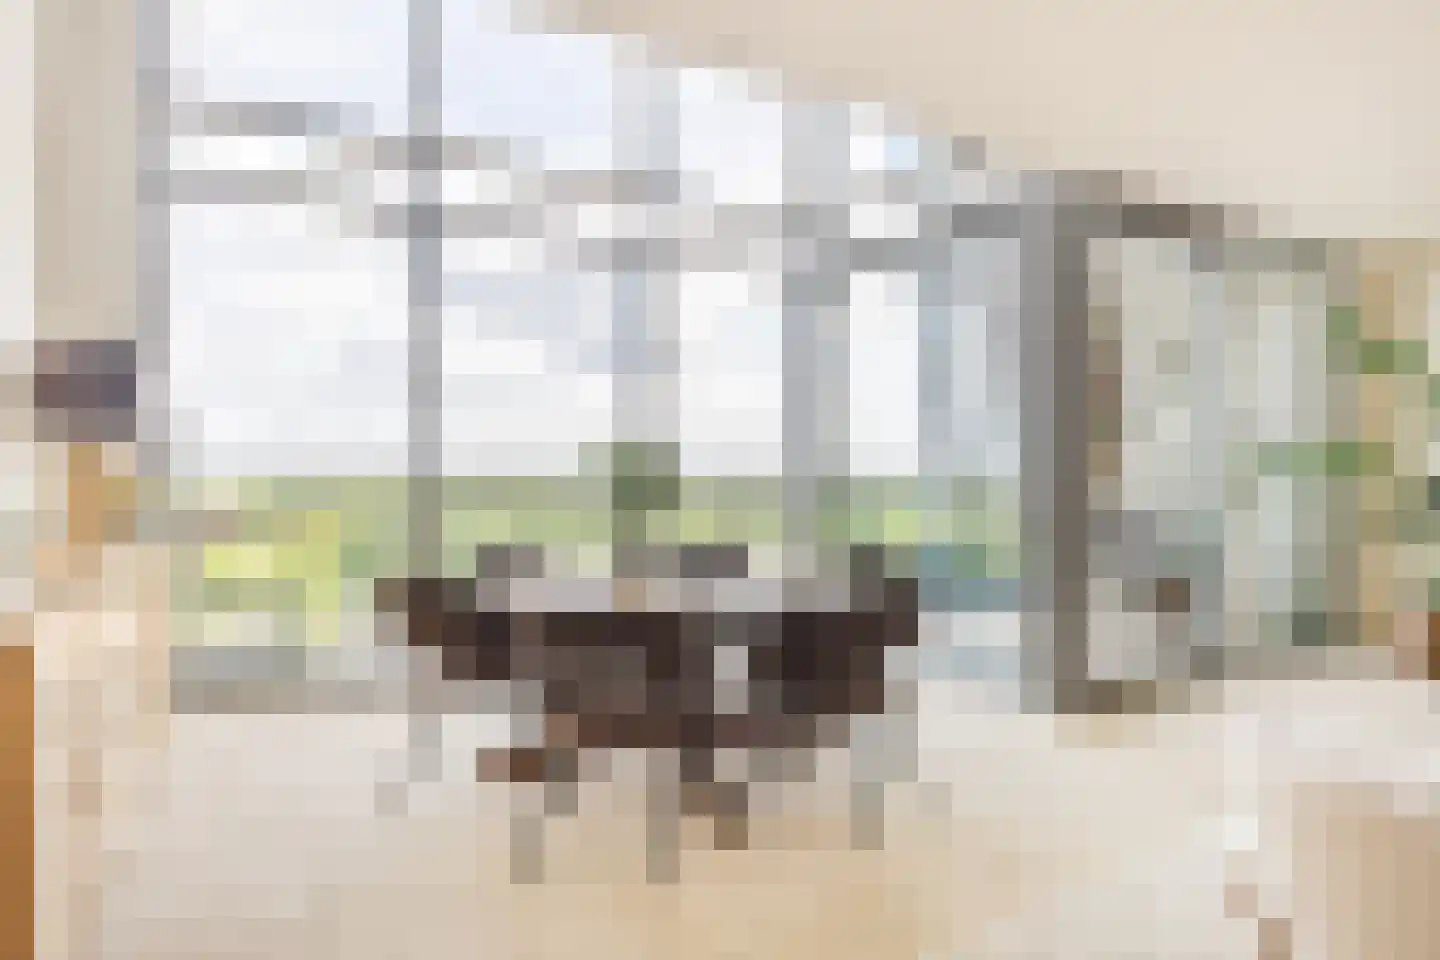
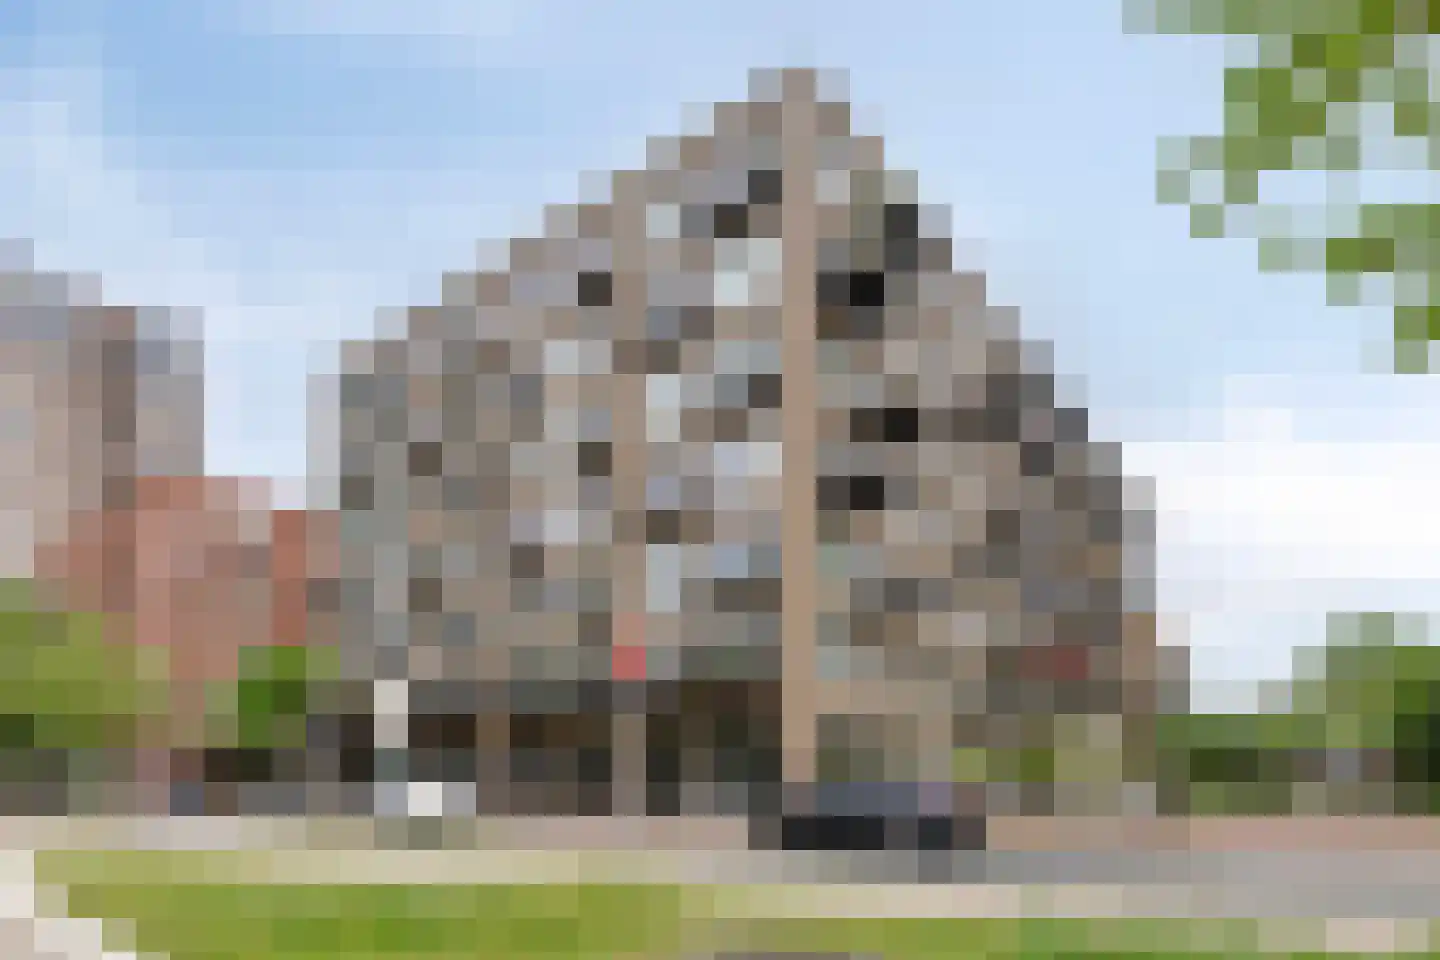
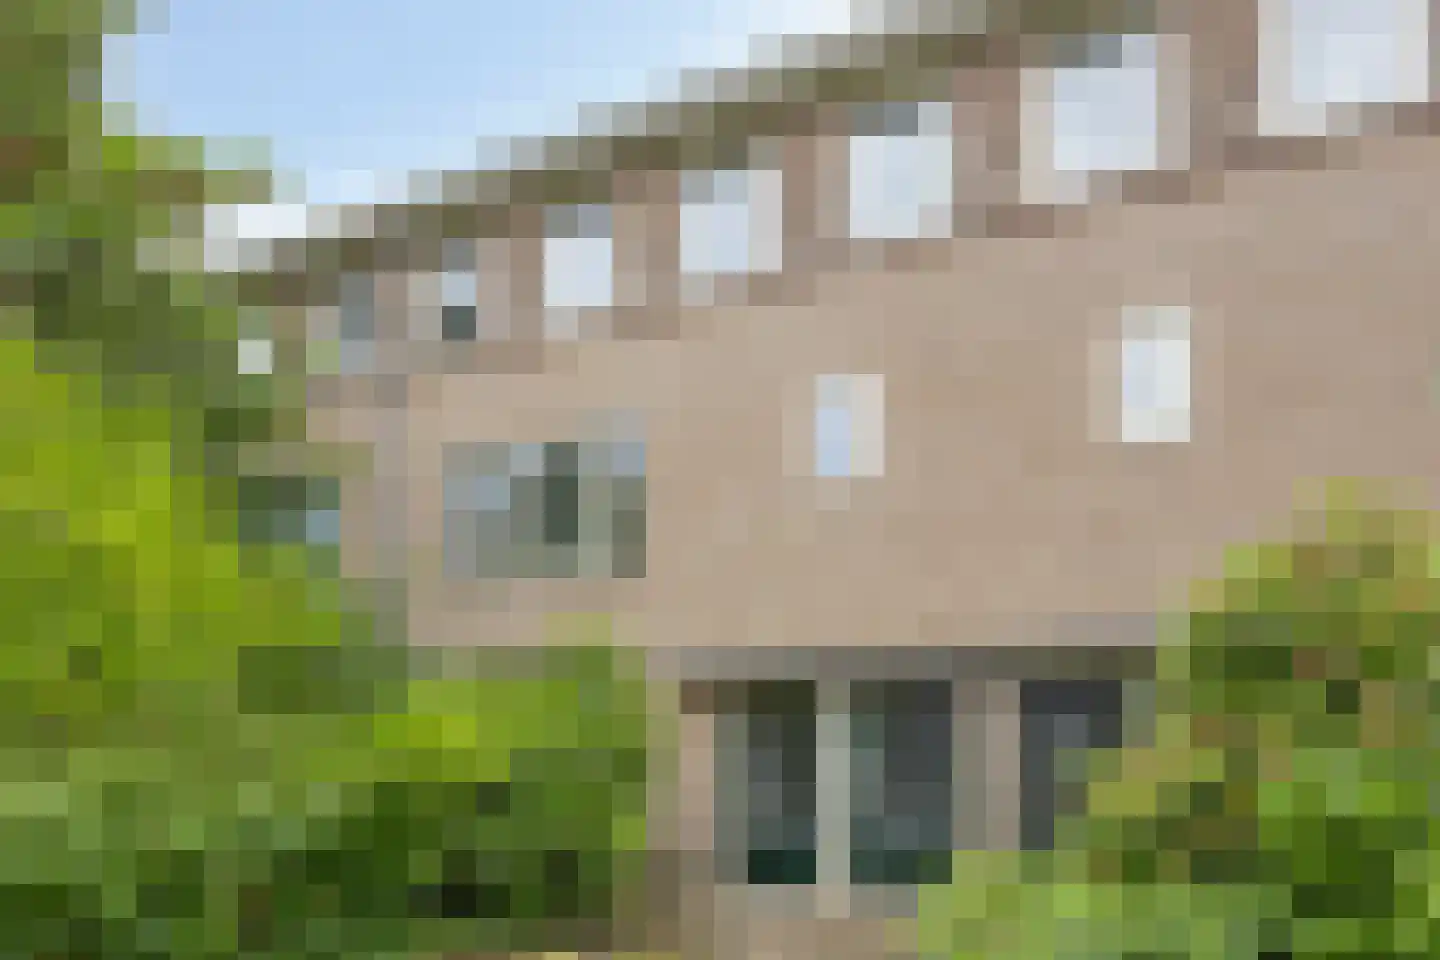
ENGLISH TEXT BELOW: Keurige, lichte tussenwoning met 4 slaapkamers, gelegen aan een rustige straat in de sfeervolle en groene wijk Stratum. Een levendige en veelzijdige buurt met een mix van woonwijken en voorzieningen. Scholen, kinderopvang en uiteenlopende sportfaciliteiten zijn op loopafstand, net als het Gerardusplein met zijn weekmarkt op vrijdag. Voor dagelijkse boodschappen zijn er diverse supermarkten en lokale winkels op loop- of fietsafstand. Ook zijn de HTC, ASML, TU/e, Genneper Parken, Genneper Hoeve gunstig gelegen. Daarnaast bevindt men zich hier op loopafstand van het city centre met bioscopen, Stadsschouwburg, Muziekcentrum Frits Philips en uitgaansgelegenheden, dus geen gedoe met parkeren en hoge parkeerkosten. De bereikbaarheid is zowel met auto als openbaar vervoer uitstekend. Er zijn meerdere bushaltes in de buurt, parkeren is gratis voor de deur en met 5-autominuten ben je de wijk uit en bevindt men zich op de N2-ring naar A2, A27 en A67. Indeling en omschrijving: Begane grond: Hal, meterkast (groepenkast recent vernieuwd). Ruime, uitgebouwde woon-/eetkamer met trapkast, veel lichtinval en tuindeuren. Halfopen keuken, voorzien van veel kastruimte, combioven, diepvries en koelkast, gaskookplaat met afzuiging, vaatwasser en warmwater boiler. Bijkeuken met aansluiting voor wasmachine en toegang tot separaat toilet. Buiten: Ruim 13 meter diepe achtertuin (middag- en avondzon) met stenen berging en achterom. Eerste verdieping: Overloop. Slaapkamer 1 aan achterzijde, met maatwerk kastenwand. Moderne badkamer met douche, badmeubel met wastafel en tweede toilet (sanibroyeur). Slaapkamer 2 aan voorzijde. Slaapkamer 3 aan voorzijde, eveneens met maatwerk kastenwand. Tweede verdieping: Via vaste steektrap bereikbaar. Ruime zolderkamer/slaapkamer met grote dakkapel, veel bergruimte achter de knieschotten en kast met opstelling combiketel. Algemene informatie: - Bouwjaar circa 1929. - Gebruiksoppervlakte wonen bijna 119 m2. - Perceel grootte circa 139 m2. - Aanvaarding is in overleg, op korte termijn bespreekbaar. - Tot zekerheid voor de nakoming van de verplichtingen dient de koper, binnen 6 weken na het totstandkomen van de overeenkomst, een schriftelijke bankgarantie te doen stellen c.q. een waarborgsom te storten ten bedragen van 10% van de koopsom. ENGLISH TEXT BELOW: Neat, bright terraced house with 4 bedrooms, located on a quiet street in the charming and green Stratum district. A lively and diverse neighborhood with a mix of residential areas and amenities. Schools, childcare, and various sports facilities are within walking distance, as is Gerardusplein with its weekly market on Fridays. For daily groceries, there are various supermarkets and local shops within walking or cycling distance. The HTC, ASML, TU/e, Genneper Parken, and Genneper Hoeve are also conveniently located. Additionally, you are within walking distance of the city centre with cinemas, the Stadsschouwburg, the Frits Philips Music Centre, and entertainment venues, so there is no hassle with parking or high parking costs. Accessibility is excellent by both car and public transport. There are several bus stops nearby, parking is free right in front of the door, and within 5 minutes by car you are out of the district and on the N2 ring road towards the A2, A27, and A67. Layout and description: Ground floor: Hall, meter cupboard (fuse box recently renewed). Spacious, extended living/dining room with under-stairs cupboard, plenty of natural light, and patio doors. Semi-open kitchen, equipped with ample cupboard space, combination oven, freezer and refrigerator, gas hob with extractor hood, dishwasher, and hot water boiler. Utility room with washing machine connection and access to a separate toilet. Outside: Over 13-meter deep backyard (afternoon and evening sun) with stone shed and rear access. First floor: Landing. Bedroom 1 at the rear, with custom-made built-in wardrobes. Modern bathroom with shower, vanity unit with washbasin, and second toilet (sanibroyeur). Bedroom 2 at the front. Bedroom 3 at the front, also with custom-made built-in wardrobes. Second floor: Accessible via a fixed staircase. Spacious attic room/bedroom with a large dormer window, ample storage space behind the knee walls, and a cupboard housing the combi boiler. General information: - Year of construction approximately 1929. - Living area nearly 119 m2. - Plot size approximately 139 m2. - Acceptance is subject to negotiation; short notice is negotiable. - To ensure compliance with the obligations, the buyer must provide a written bank guarantee or deposit a security deposit amounting to 10% of the purchase price within 6 weeks of the conclusion of the agreement.
€ 485.000
Cost of copper (estimated): € 11.550
2% transfer tax (€ 9.700) + notary (€ 1.150) + valuation (€ 700)
Total purchase (incl. p.p.): € 496.550
3,21%
Yearly
€ 24.250
Direct available
Estimated mortgage
Indicative gross monthly cost
Based on annuity and 30 year term
Indicative net monthly cost
iDisclaimer: this mortgage calculation is a simplified indication based on general assumptions. No rights can be derived from the results shown. Calculated with 10-annual interest (zonder NHG), automatically determined based on the price limit € 470.000. Source: 10-jaars rente uit mortgage_rates (08-06-2026 03:45). For non-NHG, an 80% mortgage of the market value has been used in this indication.
Douche, toilet, en wastafel
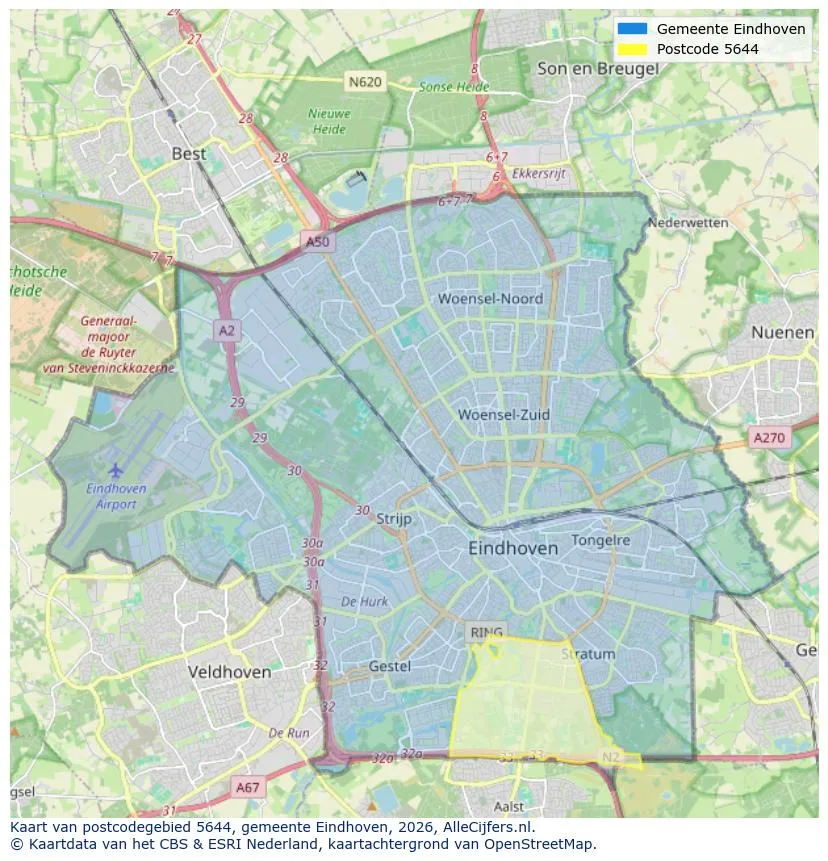
Discover where agents are active in Eindhoven
View current location data on residents, WOZ development, housing stock, energy consumption, business activity and safety in Eindhoven. In 2026 were there 249.873 residents. The average WOZ value in 2025 is EUR 391.000.
Residents
249.873
Last year: 2026
Average WOZ
EUR 391.000
Last year: 2025
Average income per person.
EUR 36.400
Source: AllNumbers
Crimes (current year)
18.880
Total registered
| Year | Residents |
|---|---|
| 2022 | 238.326 |
| 2023 | 243.730 |
| 2024 | 246.417 |
| 2025 | 249.035 |
| 2026 | 249.873 |
| Year | Average WOZ |
|---|---|
| 2021 | EUR 287.000 |
| 2022 | EUR 314.000 |
| 2023 | EUR 360.000 |
| 2024 | EUR 363.000 |
| 2025 | EUR 391.000 |
Hoger
43
Praktisch
24
Middelbaar
34
Europa
36.936
Nederland
134.959
Buiten Europa
77.140
Label A
34.103
Label C
29.742
Label B
19.304
Label D
11.177
Label E
9.327
Label F
6.306
Label A+
5.788
Label G
4.088
Label A++
3.731
Label A+++
2.635
Label A++++
578
Label A+++++
42
| Year | Gas (m3) | Electricity (kWh) |
|---|---|---|
| 2020 | 1.040 | 2.540 |
| 2021 | 1.140 | 2.570 |
| 2022 | 900 | 2.400 |
| 2023 | 770 | 2.270 |
| 2024 | 750 | 2.310 |
Hoekwoning
Gas: 970 • Electricity: 2.650
Huurwoning
Gas: 670 • Electricity: 1.900
Koopwoning
Gas: 890 • Electricity: 2.740
Appartement
Gas: 550 • Electricity: 1.710
Tussenwoning
Gas: 830 • Electricity: 2.450
Vrijstaande woning
Gas: 1.400 • Electricity: 4.320
Twee-onder-één-kap woning
Gas: 1.210 • Electricity: 3.250
Total number of company establishments: 33.545
| Period | Crimes |
|---|---|
| jan 2025 | 1.526 |
| jan 2026 | 1.357 |
| jul 2025 | 1.556 |
| jun 2025 | 1.564 |
| mei 2025 | 1.610 |
| mrt 2025 | 1.666 |
| nov 2024 | 1.768 |
| nov 2025 | 1.541 |
| okt 2024 | 1.807 |
| okt 2025 | 1.706 |
| sep 2024 | 1.612 |
| sep 2025 | 1.579 |
These figures give an indicative picture of safety trends in the living environment of Eindhoven.
Short answers based on current local statistics, handy for a quick comparison of the living environment.
Eindhoven telt in 2026 ongeveer 249.873 inwoners.
De gemiddelde WOZ-waarde in Eindhoven is in 2025 circa € 391.000.
Het gemiddelde inkomen per inwoner in Eindhoven ligt rond € 36.400 per jaar.
Voor het huidige jaar gaat het om ongeveer 18.880 geregistreerde misdrijven. Gebruik deze cijfers als indicatie en vergelijk trends per periode.
In Eindhoven komt vooral "Appartementen" veel voor, met ongeveer 58.911 woningen.
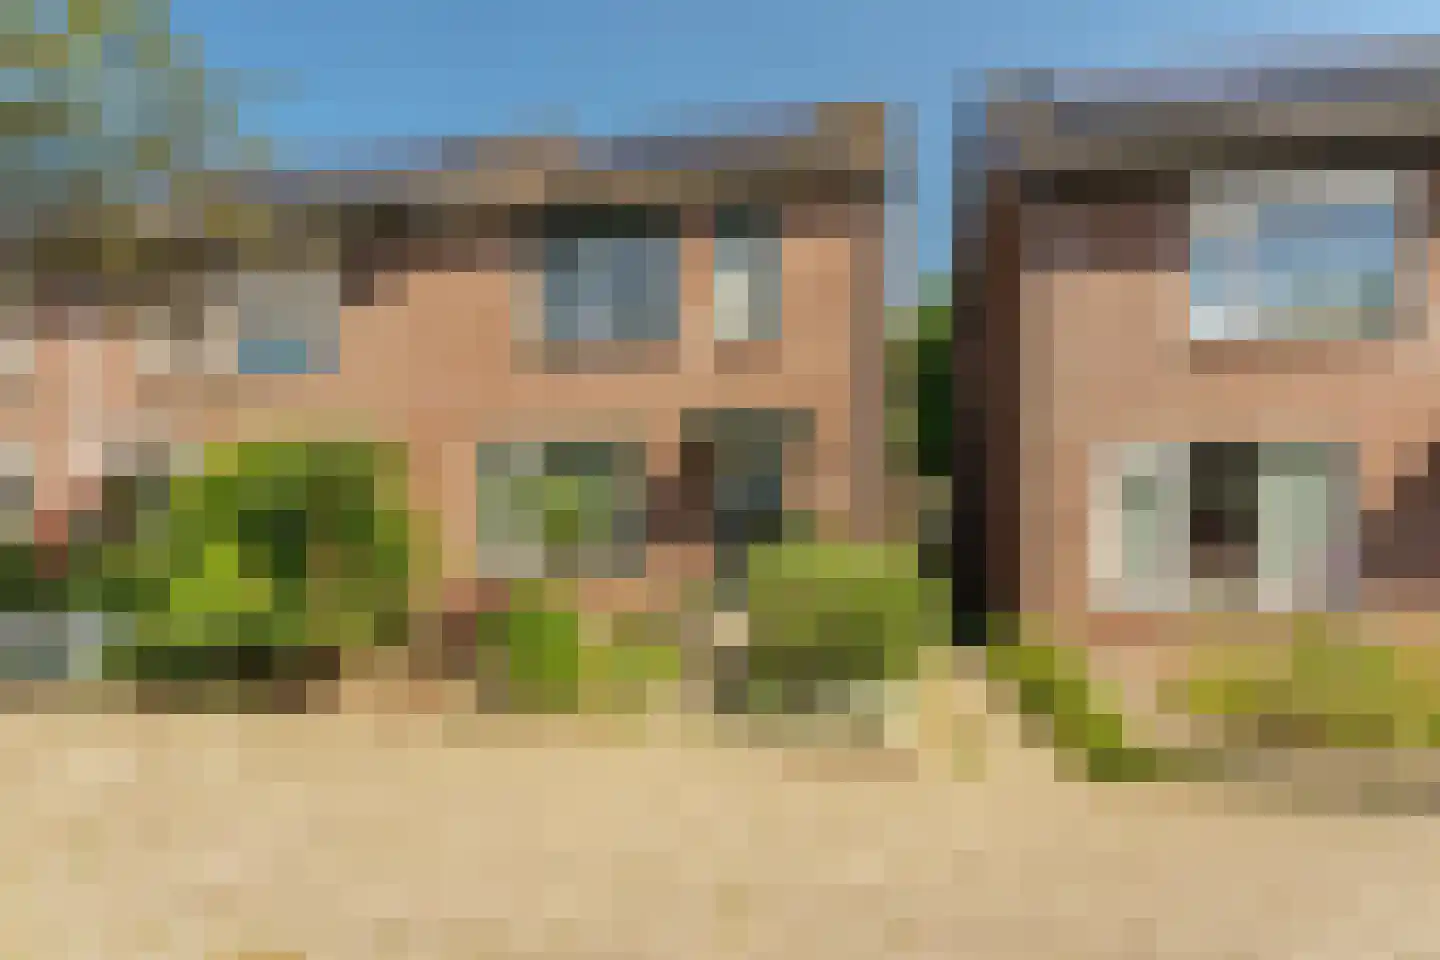
View more homes in this location.
5631BB Eindhoven
€ 785.000 k.k.
€ 3.668/m²
5617AL Eindhoven
€ 389.500 k.k.
€ 5.902/m²
5614CJ Eindhoven
€ 349.000 k.k.
€ 3.921/m²

5625AG Eindhoven
€ 1.820 p/m
€ 19/m²
5632MB Eindhoven
€ 325.000 k.k.
€ 3.037/m²

5658PJ Eindhoven
€ 2.500.000 k.k.
€ 7.862/m²

5658CK Eindhoven
€ 580.000 k.k.
€ 4.328/m²
5623NT Eindhoven
€ 489.000 k.k.
€ 3.976/m²
