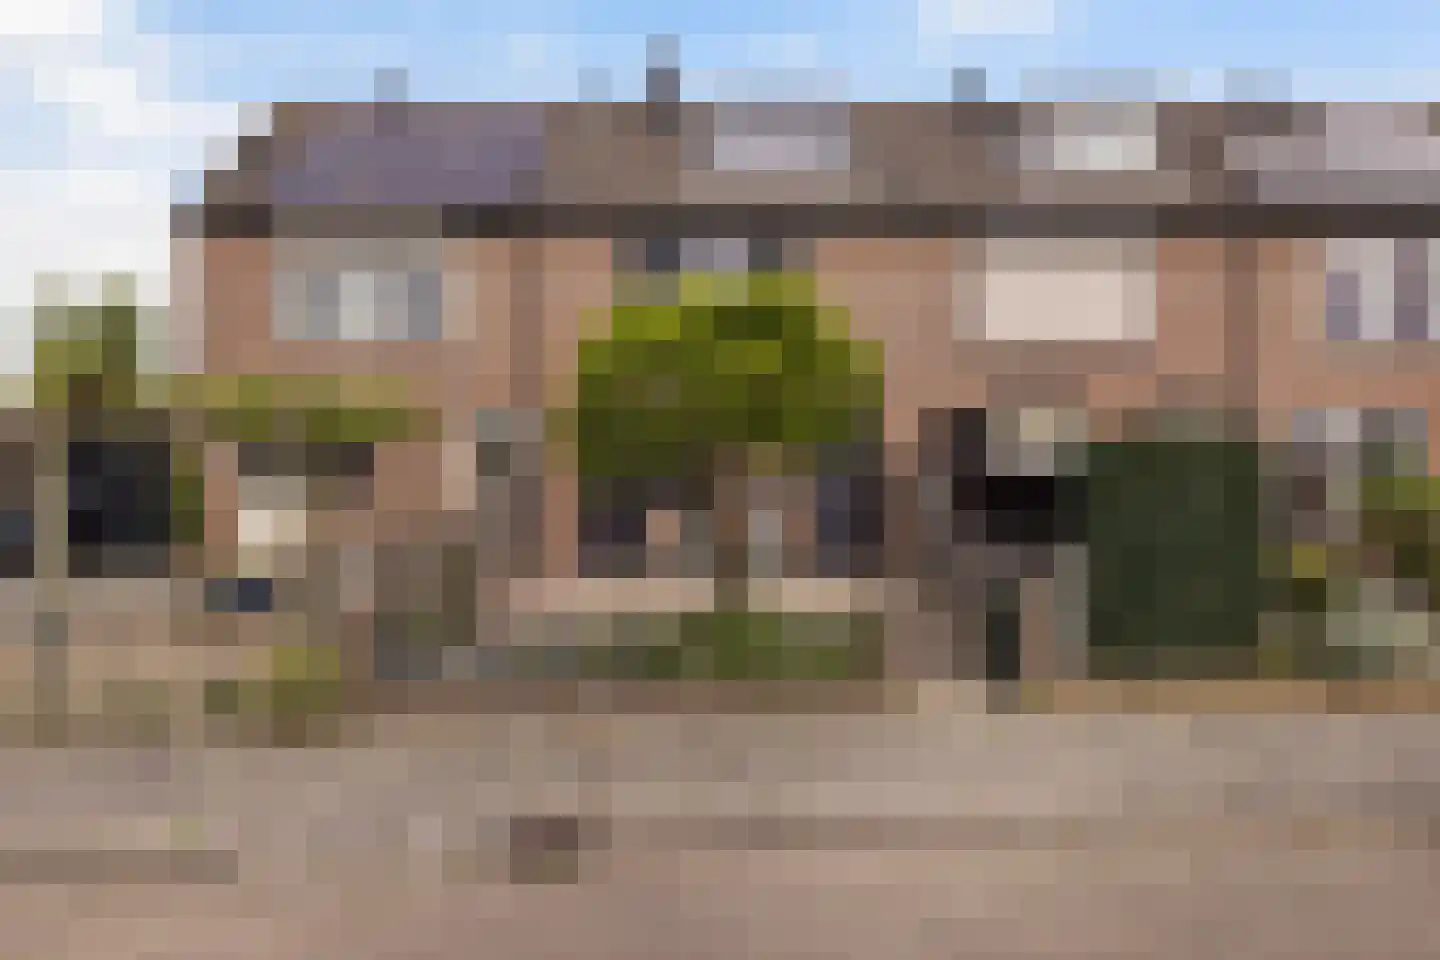
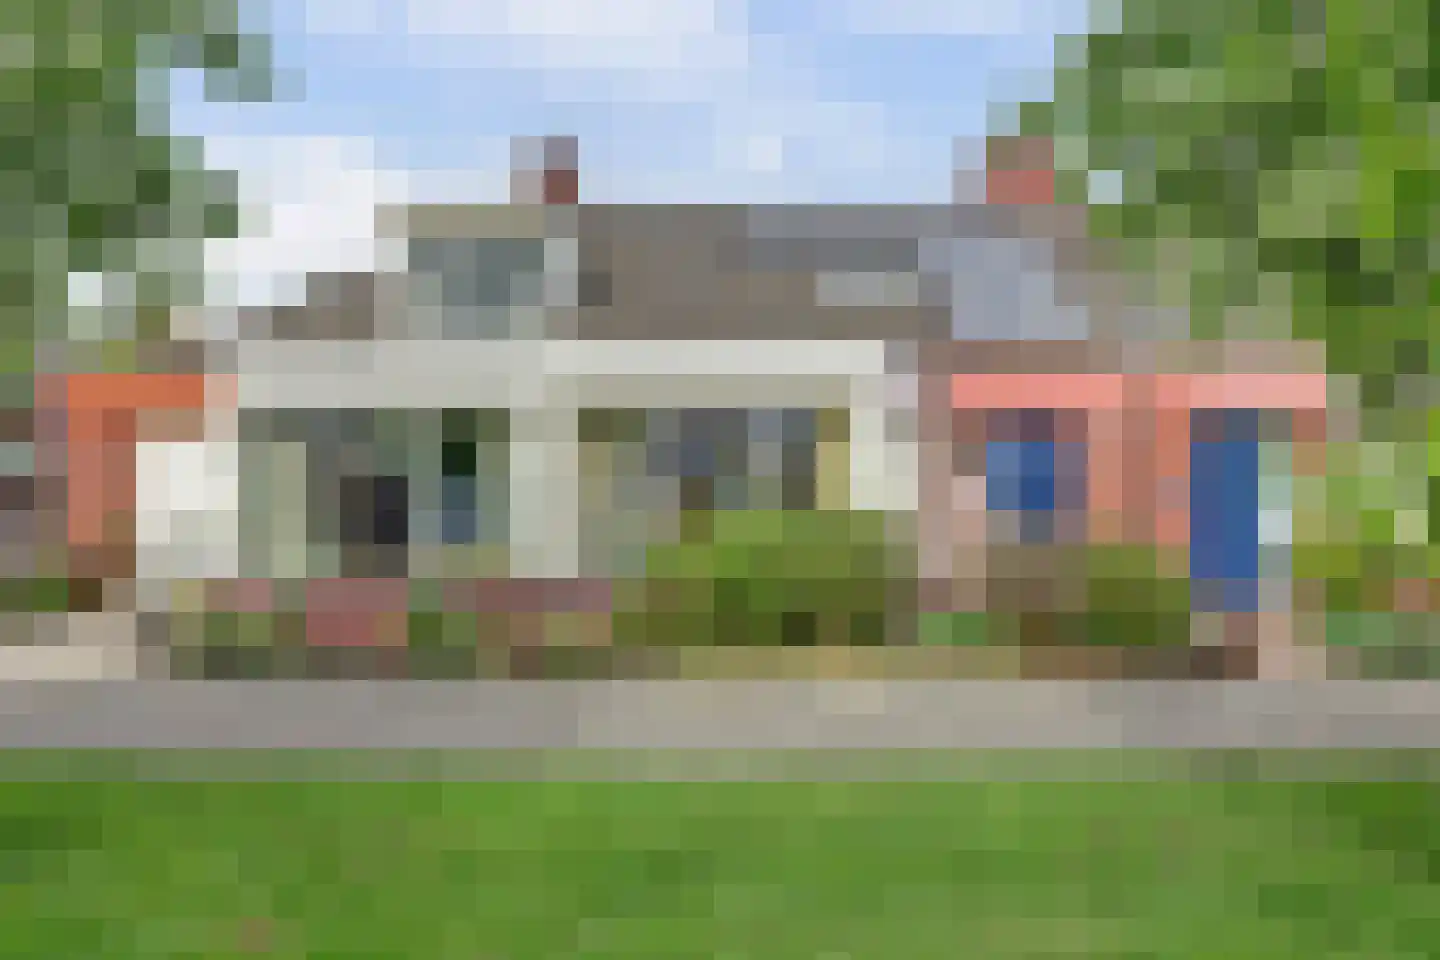
- Available
Griendweg 23
3211XC Geervliet
€ 475.000 k.k.
€ 3.209/m²
- Living area
- 148 m²
- Land area
- 243 m²
- Bedrooms
- 4
Searching in 17 houses in Geervliet
Type to search. Use arrow down and arrow up to navigate through results and press Enter to open.
Hidden search suggestions.
View current properties in Geervliet or search targeted on street, postal code and property characteristics.
View the current housing stock in Geervliet and quickly filter by price, living area, rooms and more. There are currently 17 houses in this place within our selection. View also 9 sold houses in Geervliet for extra insight into the local housing market.
3211XC Geervliet
€ 475.000 k.k.
€ 3.209/m²
3211XW Geervliet
€ 475.000 k.k.
€ 4.524/m²
3211BA Geervliet
€ 525.000 k.k.
3211XK Geervliet
€ 395.000 k.k.
3211AD Geervliet
€ 595.000 k.k.
€ 3.500/m²
3211LD Geervliet
€ 1.175.000 k.k.
€ 5.021/m²
3211BG Geervliet
€ 799.500 k.k.
€ 4.079/m²
3211XZ Geervliet
€ 425.000 k.k.
€ 3.484/m²
3211XN Geervliet
€ 425.000 k.k.
€ 3.632/m²
3211XJ Geervliet
€ 375.000 k.k.
€ 3.440/m²
3211XJ Geervliet
€ 365.000 k.k.
€ 0/m²
3211AV Geervliet
€ 350.000 k.k.
€ 0/m²
3211XT Geervliet
€ 375.000 k.k.
€ 3.260/m²
3211XE Geervliet
€ 375.000 k.k.
€ 3.048/m²
3211XW Geervliet
€ 380.000 k.k.
€ 3.800/m²
3211BE Geervliet
€ 699.000 k.k.
€ 5.825/m²
3211BN Geervliet
€ 449.500 k.k.
€ 2.827/m²
Get free quotes from real estate agents with local market knowledge. Compare more than 62 real estate agents in Geervliet.
Selling a home in Geervliet? Compare all real estate agents in Geervliet or view the top 10 real estate agents in Geervliet for extra context for your choice.
Real estate agents make sharper offers when they know you're comparing — ask for quotes for sale or purchase.
Practical answers about housing supply, sales and comparing real estate agents in Geervliet.
The costs of a real estate agent in Geervliet depend on commission, setup costs, property presentation and the chosen service. Compare the 62 real estate agents in Geervliet via the real estate agent page and request multiple quotes to compare rates and approach well.
Within our selection, we are currently showing 17 houses in Geervliet. View also the sold houses in Geervliet to compare the current offering with recent transactions.
Take into account not only price and living area but also maintenance, energy label, location, outdoor space and sales status. This way you compare houses in Geervliet on more than just the asking price.
A local real estate agent knows the neighborhoods, recent transactions and demand in Geervliet. By comparing 62 real estate agents in the region you get a better insight into prices, sales strategy and expected yield; the top 10 in Geervliet provides a useful starting point.
Yes, when making a sales plan, a valuation in Geervliet is wise. You gain insight into a realistic asking price and can then compare offers from real estate agents specifically.
View current location data on residents, WOZ development, housing stock, energy consumption, business activity and safety in Geervliet. In 2025 were there 1.680 residents. The average WOZ value in 2025 is EUR 326.000.
These figures help to better assess and compare the housing stock in Geervliet with recent sold homes. Orient yourself then on suitable top real estate agents in Geervliet for sales advice in this region.
Residents
1.680
Last year: 2025
Average WOZ
EUR 326.000
Last year: 2025
Average income per person.
EUR 35.400
Source: AllNumbers
Crimes (current year)
68
Total registered
| Year | Residents |
|---|---|
| 2021 | 1.620 |
| 2022 | 1.630 |
| 2023 | 1.630 |
| 2024 | 1.695 |
| 2025 | 1.680 |
| Year | Average WOZ |
|---|---|
| 2021 | EUR 246.000 |
| 2022 | EUR 264.000 |
| 2023 | EUR 303.000 |
| 2024 | EUR 308.000 |
| 2025 | EUR 326.000 |
Hoger
280
Praktisch
290
Middelbaar
660
Europa
140
Nederland
1.380
Buiten Europa
150
Label C
290
Label B
102
Label D
101
Label A
94
Label G
61
Label F
55
Label A+
35
Label A++
21
Label E
17
Label A+++
2
Label A++++
0
Label A+++++
0
| Year | Gas (m3) | Electricity (kWh) |
|---|---|---|
| 2020 | 1.210 | 2.870 |
| 2021 | 1.390 | 2.930 |
| 2022 | 1.020 | 2.740 |
| 2023 | 870 | 2.580 |
| 2024 | 840 | 2.790 |
Hoekwoning
Gas: 870 • Electricity: 2.520
Huurwoning
Gas: 700 • Electricity: 1.950
Koopwoning
Gas: 970 • Electricity: 2.950
Appartement
Gas: 580 • Electricity: 1.630
Tussenwoning
Gas: 740 • Electricity: 2.330
Vrijstaande woning
Gas: 1.350 • Electricity: 4.050
Twee-onder-één-kap woning
Gas: 1.020 • Electricity: 2.510
Total number of company establishments: 160
| Period | Crimes |
|---|---|
| jan 2025 | 9 |
| jan 2026 | 2 |
| jul 2025 | 5 |
| jun 2025 | 3 |
| mei 2025 | 7 |
| mrt 2025 | 6 |
| nov 2024 | 3 |
| nov 2025 | 6 |
| okt 2024 | 5 |
| okt 2025 | 1 |
| sep 2024 | 7 |
| sep 2025 | 7 |
These figures give an indicative picture of safety trends in the living environment of Geervliet.
Short answers based on current local statistics, handy for a quick comparison of the living environment.
Geervliet telt in 2025 ongeveer 1.680 inwoners.
De gemiddelde WOZ-waarde in Geervliet is in 2025 circa € 326.000.
Het gemiddelde inkomen per inwoner in Geervliet ligt rond € 35.400 per jaar.
Voor het huidige jaar gaat het om ongeveer 68 geregistreerde misdrijven. Gebruik deze cijfers als indicatie en vergelijk trends per periode.
In Geervliet komt vooral "Tussenwoningen" veel voor, met ongeveer 371 woningen.