Residents
7.544
Last year: 2026
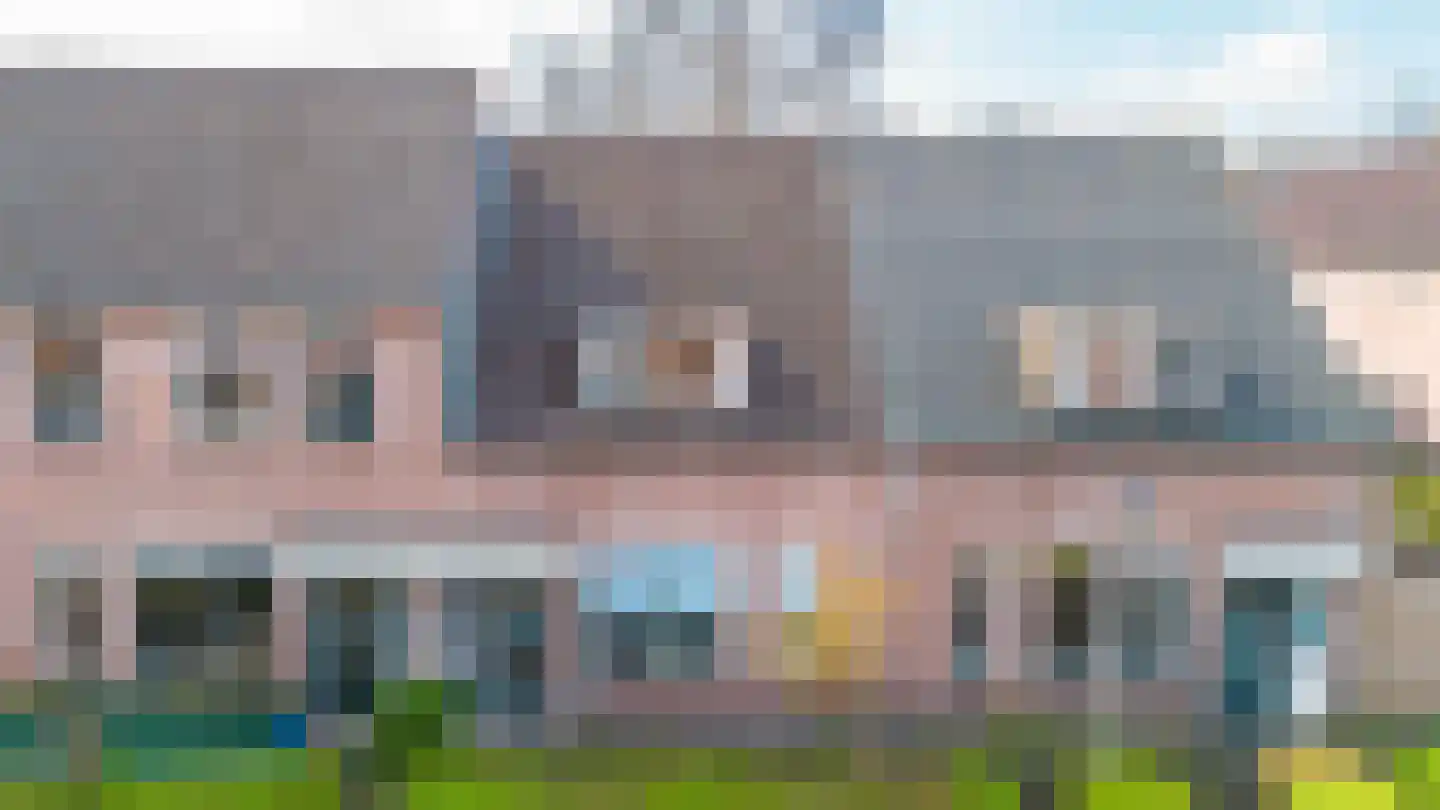
8401WC Gorredijk • Fryslân
€ 249.500 k.k.
Cost of copper (estimated): € 6.840
2% transfer tax (€ 4.990) + notary (€ 1.150) + valuation (€ 700)
Total incl. VAT: € 256.340
Purchase price /m²: € 2.935
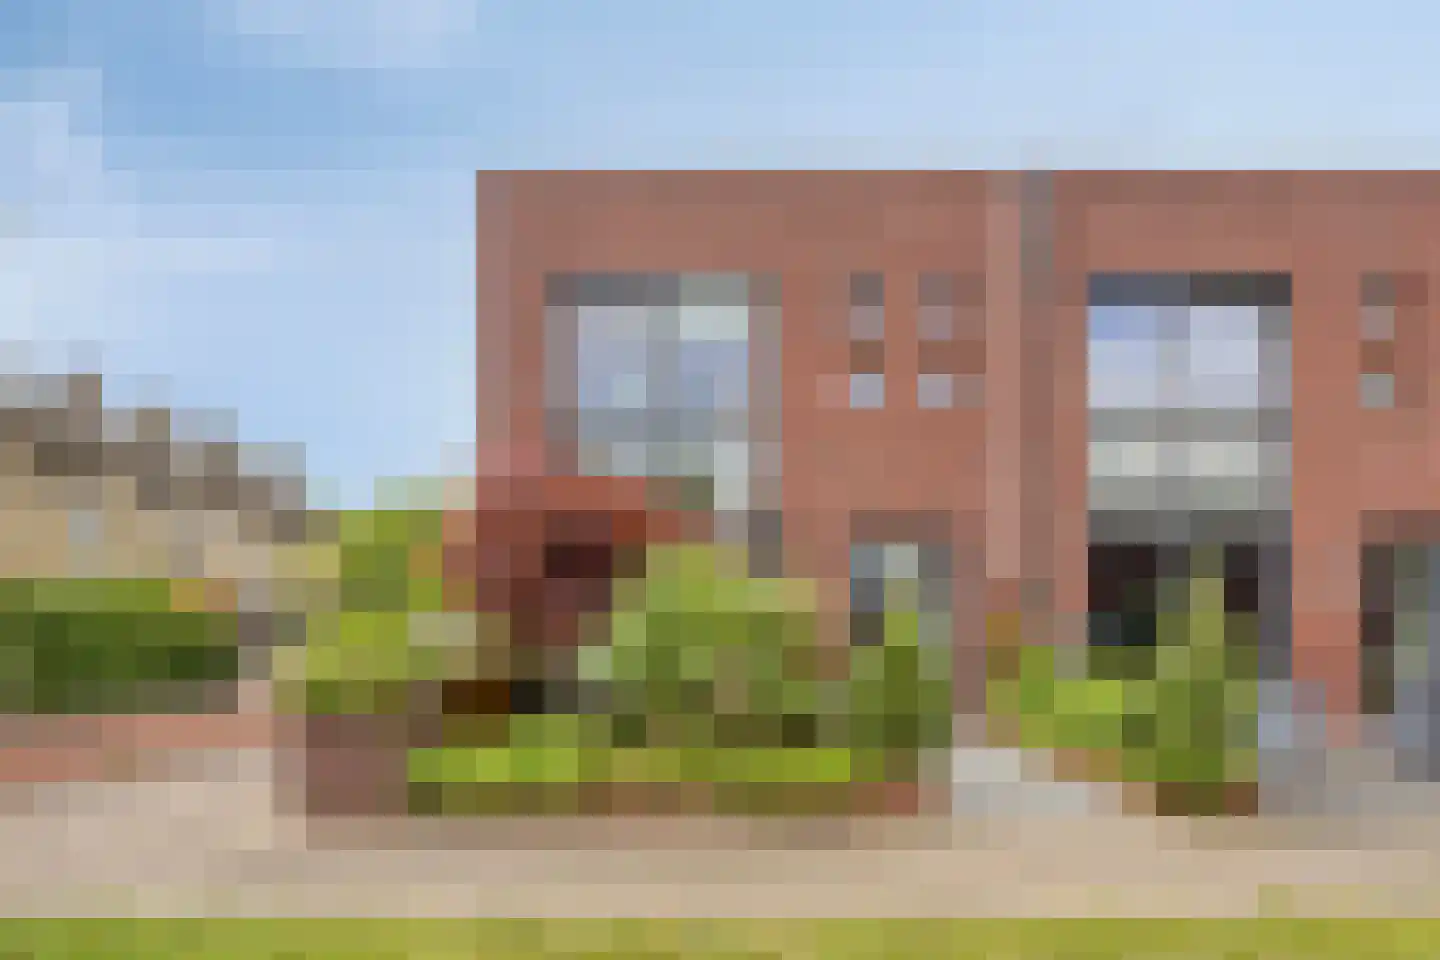
Graag ontvangen wij uw bezichtigingsaanvraag bij voorkeur per mail. Het is goed om te weten dat de bezichtigingen worden ingepland op dinsdagmiddag 28 april, woensdagmiddag 29 april en donderdagochtend 30 april. U ontvangt uiterlijk binnen twee werkdagen na verzending van uw mail verdere informatie over het vervolg. Starters en doorstarters opgelet! Nette, instapklare tussenwoning met nieuwe keuken en badkamer. Gelegen in een woonwijk van de jaren tachtig op loopafstand van het centrum. De achtertuin ligt op het zuid-oosten en grenst aan een speelveld waardoor je geen directe achterburen maar wel de zon hebt. Indeling: Begane grond: hal met meterkast, woonkamer met keurige laminaatvloer en een trapkast, open keuken met moderne keukeninrichting voorzien van inbouwapparatuur, achterentree, hal met toilet en trapopgang. Verdieping: overloop, 2 ruime slaapkamers en een keurige badkamer met douche, wastafel en kasten waarin ruimte voor een wasmachine en droger. Zolderverdieping: bereikbaar via een vlizotrap, berging en opstelling cv-ketel. Voor een nog beter idee van de indeling verwijzen wij naar de plattegronden, de foto’s én de unieke mogelijkheid van een virtuele rondleiding. Deze 3D rondleiding is zowel via onze website als Funda te bewonderen en geeft u al een prachtig en waarheidsgetrouw beeld. U kunt namelijk op een ‘Google-street-view-achtige manier’ door de gehele woning wandelen. De achtertuin ligt op het zuidoosten, grenst aan een speelveld, is ook bereikbaar via een achterom en heeft naast een terras en gazon een goede stenen schuur voor fietsen en tuingereedschap. Gorredijk is een gezellig dorp aan de vaart (met sluis in de turfroute). Het dorp heeft alle voorzieningen, zoals meerdere supermarkten, gezellige winkeltjes, grote sportaccommodatie en een groot aantal (sport)verenigingen en meerdere scholen (inclusief voortgezet). De natuurgebieden van Lippenhuizen, Hemrik, Beetsterzwaag, Oldeberkoop, Oudehorne e.d. zijn dichtbij (fietsafstand). Gorredijk is goed bereikbaar door de prima busverbindingen en de ligging nabij de A7. We nodigen u van harte uit om de woning met eigen ogen te bewonderen. Neem desgewenst uw eigen NVM Makelaar mee! Bijzonderheden: - Deels kunststof kozijnen met isolerende beglazing - Keuken (2023) met inductie kookplaat voorzien van afzuiging, vaatwasser, combi-oven, koelkast en een vriezer - Badkamer (2022) met douche, wastafel en aansluiting voor de wasmachine - Achtertuin op het zuid-oosten - Twee ruime slaapkamers - Verwarming en warm water d.m.v. CV ketel, Intergas 2009 - Kopers (voor eigen gebruik) tussen 18 en 35 jaar kunnen eenmalig vrijgesteld worden van overdrachtsbelasting
€ 249.500
Cost of copper (estimated): € 6.840
2% transfer tax (€ 4.990) + notary (€ 1.150) + valuation (€ 700)
Total purchase (incl. p.p.): € 256.340
3,02%
Yearly
€ 12.475
Direct available
Estimated mortgage
Indicative gross monthly cost
Based on annuity and 30 year term
Indicative net monthly cost
iDisclaimer: this mortgage calculation is a simplified indication based on general assumptions. No rights can be derived from the results shown. Calculated with 10-annual interest (met NHG), automatically determined based on the price limit € 470.000. Source: 10-jaars rente uit mortgage_rates (08-06-2026 03:45).
Inloopdouche, wastafel, en wastafelmeubel
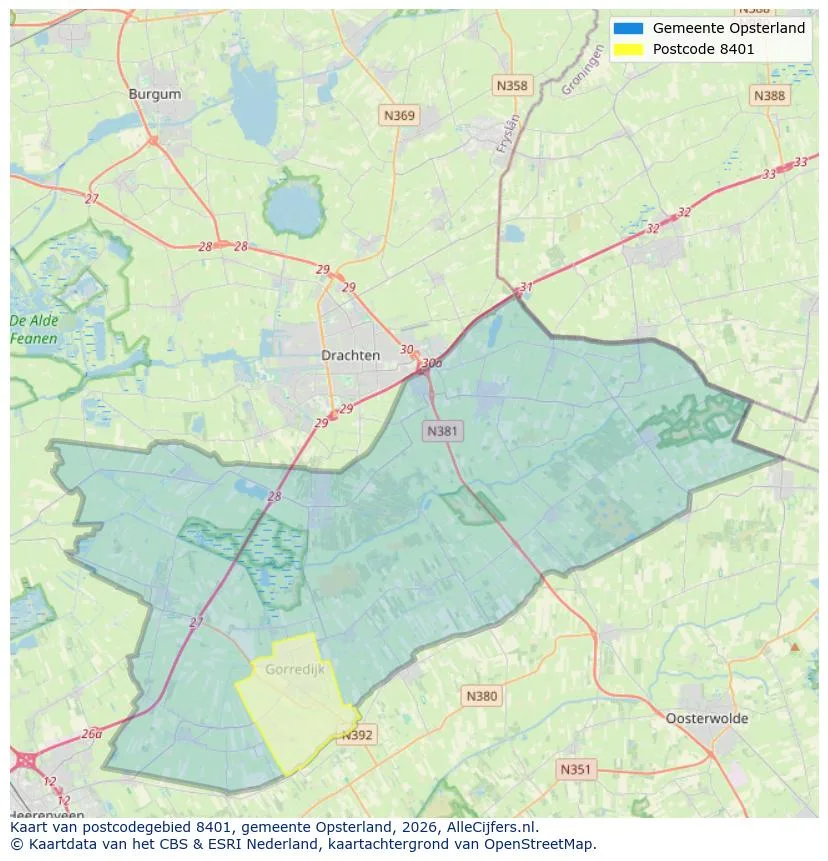
Discover where agents are active in Gorredijk
View current location data on residents, WOZ development, housing stock, energy consumption, business activity and safety in Gorredijk. In 2026 were there 7.544 residents. The average WOZ value in 2025 is EUR 292.000.
Residents
7.544
Last year: 2026
Average WOZ
EUR 292.000
Last year: 2025
Average income per person.
EUR 29.900
Source: AllNumbers
Crimes (current year)
133
Total registered
| Year | Residents |
|---|---|
| 2021 | 7.415 |
| 2022 | 7.325 |
| 2023 | 7.430 |
| 2024 | 7.525 |
| 2025 | 7.480 |
| 2026 | 7.544 |
| Year | Average WOZ |
|---|---|
| 2021 | EUR 216.000 |
| 2022 | EUR 238.000 |
| 2023 | EUR 277.000 |
| 2024 | EUR 285.000 |
| 2025 | EUR 292.000 |
Hoger
1.450
Praktisch
1.460
Middelbaar
2.440
Europa
360
Nederland
6.600
Buiten Europa
520
Label A
1.120
Label C
839
Label B
587
Label D
346
Label G
332
Label F
171
Label E
116
Label A+++
112
Label A++++
81
Label A+
41
Label A++
25
Label A+++++
2
| Year | Gas (m3) | Electricity (kWh) |
|---|---|---|
| 2020 | 1.300 | 2.660 |
| 2021 | 1.380 | 2.740 |
| 2022 | 1.080 | 2.560 |
| 2023 | 910 | 2.460 |
| 2024 | 860 | 2.560 |
Hoekwoning
Gas: 860 • Electricity: 2.440
Huurwoning
Gas: 690 • Electricity: 2.070
Koopwoning
Gas: 1.050 • Electricity: 2.710
Appartement
Gas: 600 • Electricity: 1.650
Tussenwoning
Gas: 810 • Electricity: 2.220
Vrijstaande woning
Gas: 1.210 • Electricity: 3.250
Twee-onder-één-kap woning
Gas: 940 • Electricity: 2.460
Total number of company establishments: 925
| Period | Crimes |
|---|---|
| jan 2026 | 10 |
| jul 2025 | 16 |
| jun 2025 | 8 |
| mei 2025 | 11 |
| mrt 2025 | 17 |
| mrt 2026 | 3 |
| nov 2024 | 10 |
| nov 2025 | 9 |
| okt 2024 | 15 |
| okt 2025 | 16 |
| sep 2024 | 6 |
| sep 2025 | 8 |
These figures give an indicative picture of safety trends in the living environment of Gorredijk.
Short answers based on current local statistics, handy for a quick comparison of the living environment.
Gorredijk telt in 2026 ongeveer 7.544 inwoners.
De gemiddelde WOZ-waarde in Gorredijk is in 2025 circa € 292.000.
Het gemiddelde inkomen per inwoner in Gorredijk ligt rond € 29.900 per jaar.
Voor het huidige jaar gaat het om ongeveer 133 geregistreerde misdrijven. Gebruik deze cijfers als indicatie en vergelijk trends per periode.
In Gorredijk komt vooral "Vrijstaande woningen" veel voor, met ongeveer 989 woningen.
View more homes in this location.
8401RP Gorredijk
€ 359.000 k.k.
€ 3.294/m²
8401TT Gorredijk
€ 524.500 k.k.
€ 4.163/m²

8401MN Gorredijk
€ 639.500 k.k.
€ 3.634/m²

8401AB Gorredijk
€ 439.500 k.k.
€ 3.959/m²

8401DK Gorredijk
€ 389.500 k.k.
€ 3.219/m²
8401EC Gorredijk
€ 395.000 k.k.
€ 2.669/m²
8401MK Gorredijk
€ 695.000 k.k.
€ 3.390/m²
8401XM Gorredijk
€ 495.000 k.k.
€ 3.561/m²
