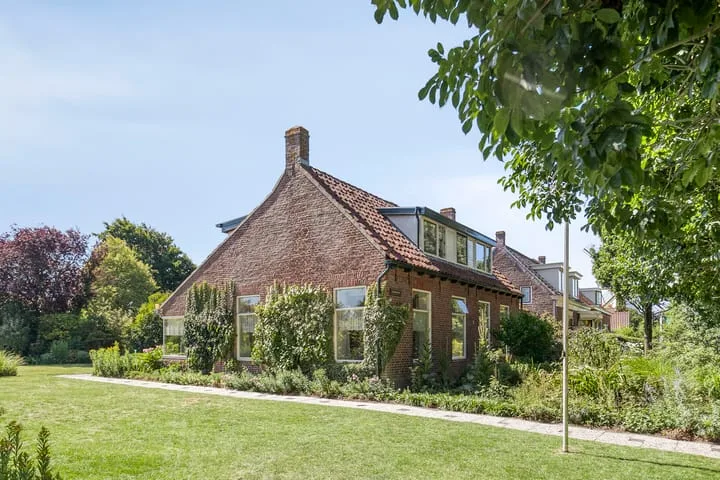
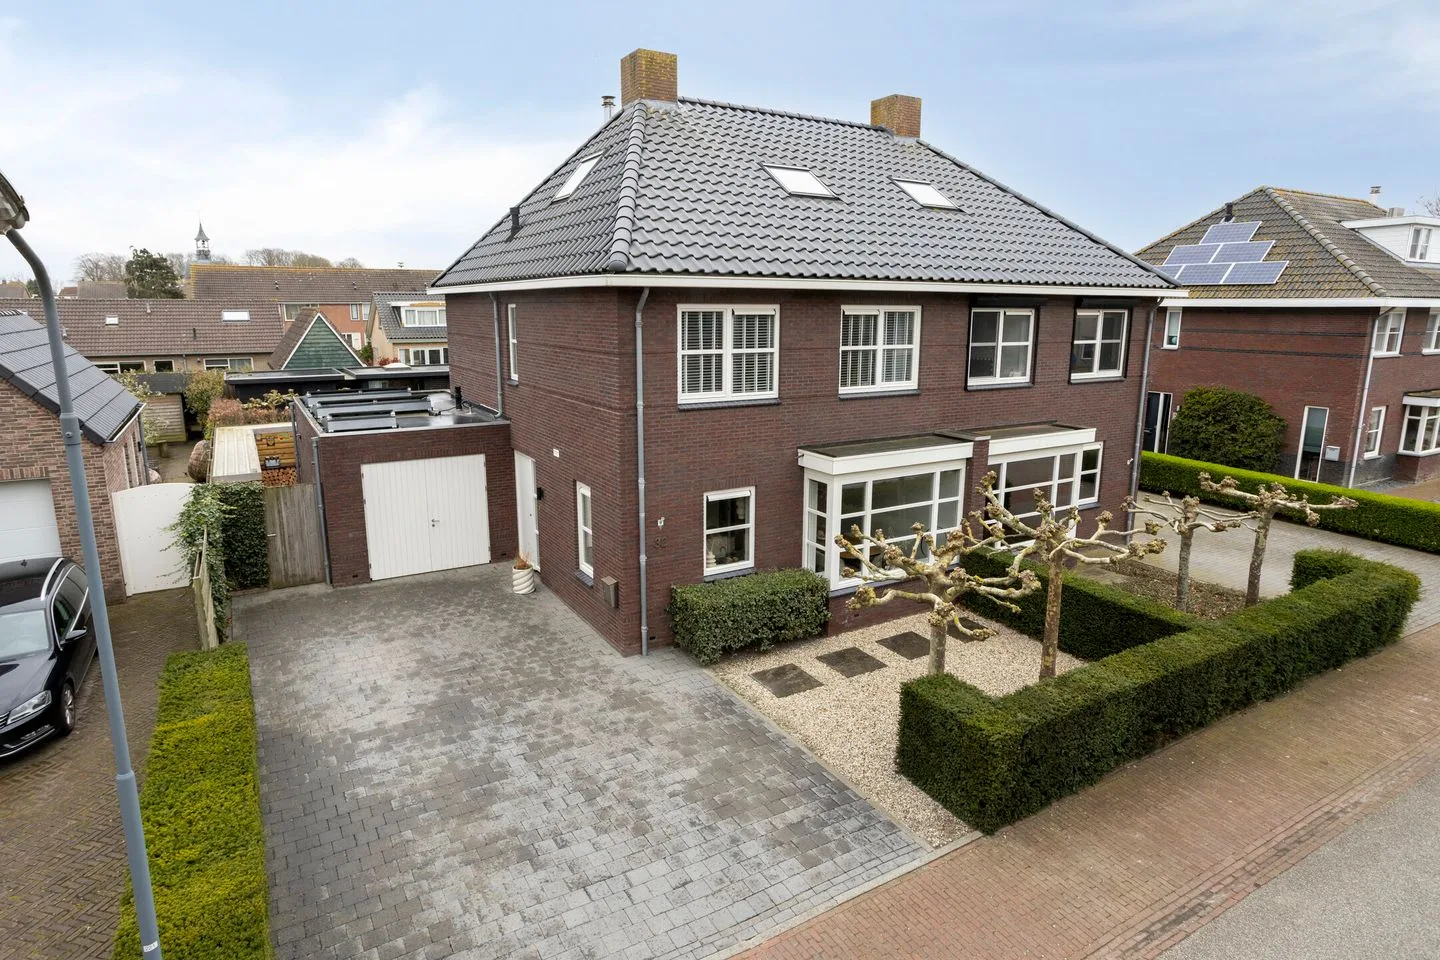
Houses sold in Grijpskerke

View 12 sold houses in Grijpskerke

Connected to: Vastgoed Nederland NVM Makelaars

On this page you will find recently sold homes in Grijpskerke. Use this overview to better estimate selling prices, popular neighborhoods, and the local housing supply before you choose a real estate agent. Also view the current housing supply with 17 houses in Grijpskerke.

Selection

Search and filter homes

Set your preferences and discover homes that suit you.

Total supply 242.874
Filters

Set price, area and other characteristics. Adjust a filter or click on Show homes. Location changes directly above.

Reset filters

You search for

  • Place Grijpskerke
  • Status Sold

Huis verkopen in Grijpskerke? Vergelijk verkoopmakelaars

Bekijk recente verkopen en ontvang gratis offertes van lokale makelaars. Vergelijk meer dan 28 makelaars in Grijpskerke.

Free request a quote

  • Quotes in Grijpskerke
  • Non-binding
  • Personal
  • Compare free rates

Zelf je woning verkopen in Grijpskerke? Vergelijk verkoopmakelaars in Grijpskerke of bekijk de beste verkoopmakelaars in Grijpskerke als referentie bij jouw keuze.

Vergelijk meerdere offertes

Makelaars maken scherpere voorstellen als ze weten dat je vergelijkt — vraag offertes aan voor verkoop of aankoop.

Frequently asked questions about sold homes in Grijpskerke

Short answers about housing prices, sold homes and comparing real estate agents in Grijpskerke.

Residential and neighborhood statistics in Grijpskerke

View current location data on residents, WOZ development, housing stock, energy consumption, business activity and safety in Grijpskerke. In 2025 were there 1.415 residents. The average WOZ value in 2025 is EUR 422.000.

These figures help to better assess and compare the housing stock in Grijpskerke with recent sold homes. Orient yourself then on suitable top real estate agents in Grijpskerke for sales advice in this region.

Residents

1.415

Last year: 2025

Average WOZ

EUR 422.000

Last year: 2025

Average income per person.

EUR 30.400

Source: AllNumbers

Crimes (current year)

21

Total registered

Demographics and WOZ development

Inhabitants per year

Inhabitants per year in Grijpskerke
Year Residents
2021 1.420
2022 1.405
2023 1.430
2024 1.400
2025 1.415

Annual WOZ value

WOZ value per year in Grijpskerke
Year Average WOZ
2021 EUR 294.000
2022 EUR 317.000
2023 EUR 358.000
2024 EUR 410.000
2025 EUR 422.000

Composition of residents

Age build-up

65+: 390 0-15: 215 15-25: 140 25-45: 250 45-65: 420

Education level

Hoger

280

Praktisch

190

Middelbaar

550

Origin of residents (2025)

Europa

70

Nederland

1.270

Buiten Europa

70

Housing stock and construction periods

Types of homes

Hoekwoningen 84
Appartementen 43
Tussenwoningen 123
Vrijstaande woningen 277
Twee-onder-één-kap woningen 130

Construction period of buildings

Voor 1700 3
1700 tot 1900 51
1900 tot 1925 36
1925 tot 1950 64
1950 tot 1970 100
1970 tot 1980 142
1980 tot 1990 82
1990 tot 2000 98
2000 tot 2010 70
2010 tot 2020 30
2020 en later 25

Energy and sustainability

Energy label distribution

Label C

136

Label B

134

Label A

130

Label G

75

Label D

60

Label F

42

Label A++

30

Label E

25

Label A+++

19

Label A+

17

Label A++++

1

Label A+++++

1

Average energy consumption per year

Average energy consumption per year in Grijpskerke
Year Gas (m3) Electricity (kWh)
2020 1.200 2.640
2021 1.360 2.910
2022 1.060 2.760
2023 920 2.650
2024 900 2.770

Consumption per house type

Hoekwoning

Gas: 720 • Electricity: 2.130

Huurwoning

Gas: 640 • Electricity: 1.850

Koopwoning

Gas: 980 • Electricity: 2.830

Appartement

Gas: 660 • Electricity: 1.870

Tussenwoning

Gas: 640 • Electricity: 2.070

Vrijstaande woning

Gas: 1.160 • Electricity: 3.260

Twee-onder-één-kap woning

Gas: 890 • Electricity: 2.510

Business activity in Grijpskerke (2025)

Handel en HORECA 35
Nijverheid en energie 35
Zakelijke dienstverlening 40
Overheid, onderwijs en zorg 25
Landbouw, bosbouw en visserij 40
Vervoer, informatie en communicatie 10
Financiele diensten en onroerendgoed 10
Cultuur, recreatie en overige diensten 15

Total number of company establishments: 210

Recent crime statistics

Recent crime statistics in Grijpskerke
Period Crimes
jan 2026 1
jul 2025 0
jun 2025 1
mei 2025 5
mrt 2025 1
mrt 2026 0
nov 2024 5
nov 2025 1
okt 2024 2
okt 2025 2
sep 2024 0
sep 2025 2

These figures give an indicative picture of safety trends in the living environment of Grijpskerke.

Frequently asked questions about living in Grijpskerke

Short answers based on current local statistics, handy for a quick comparison of the living environment.

Hoeveel inwoners heeft Grijpskerke?

Grijpskerke telt in 2025 ongeveer 1.415 inwoners.

Wat is de gemiddelde WOZ-waarde in Grijpskerke?

De gemiddelde WOZ-waarde in Grijpskerke is in 2025 circa € 422.000.

Wat is het gemiddelde inkomen per inwoner in Grijpskerke?

Het gemiddelde inkomen per inwoner in Grijpskerke ligt rond € 30.400 per jaar.

Hoe veilig is wonen in Grijpskerke?

Voor het huidige jaar gaat het om ongeveer 21 geregistreerde misdrijven. Gebruik deze cijfers als indicatie en vergelijk trends per periode.

Welke woningtypen komen het meest voor in Grijpskerke?

In Grijpskerke komt vooral "Vrijstaande woningen" veel voor, met ongeveer 277 woningen.

Receive free, non-binding quotes

Compare multiple real estate agents and choose the best match.