Residents
3.056
Last year: 2026
6247BS Gronsveld • Limburg
€ 699.000 k.k.
Cost of copper (estimated): € 15.830
2% transfer tax (€ 13.980) + notary (€ 1.150) + valuation (€ 700)
Total incl. VAT: € 714.830
Purchase price /m²: € 2.763
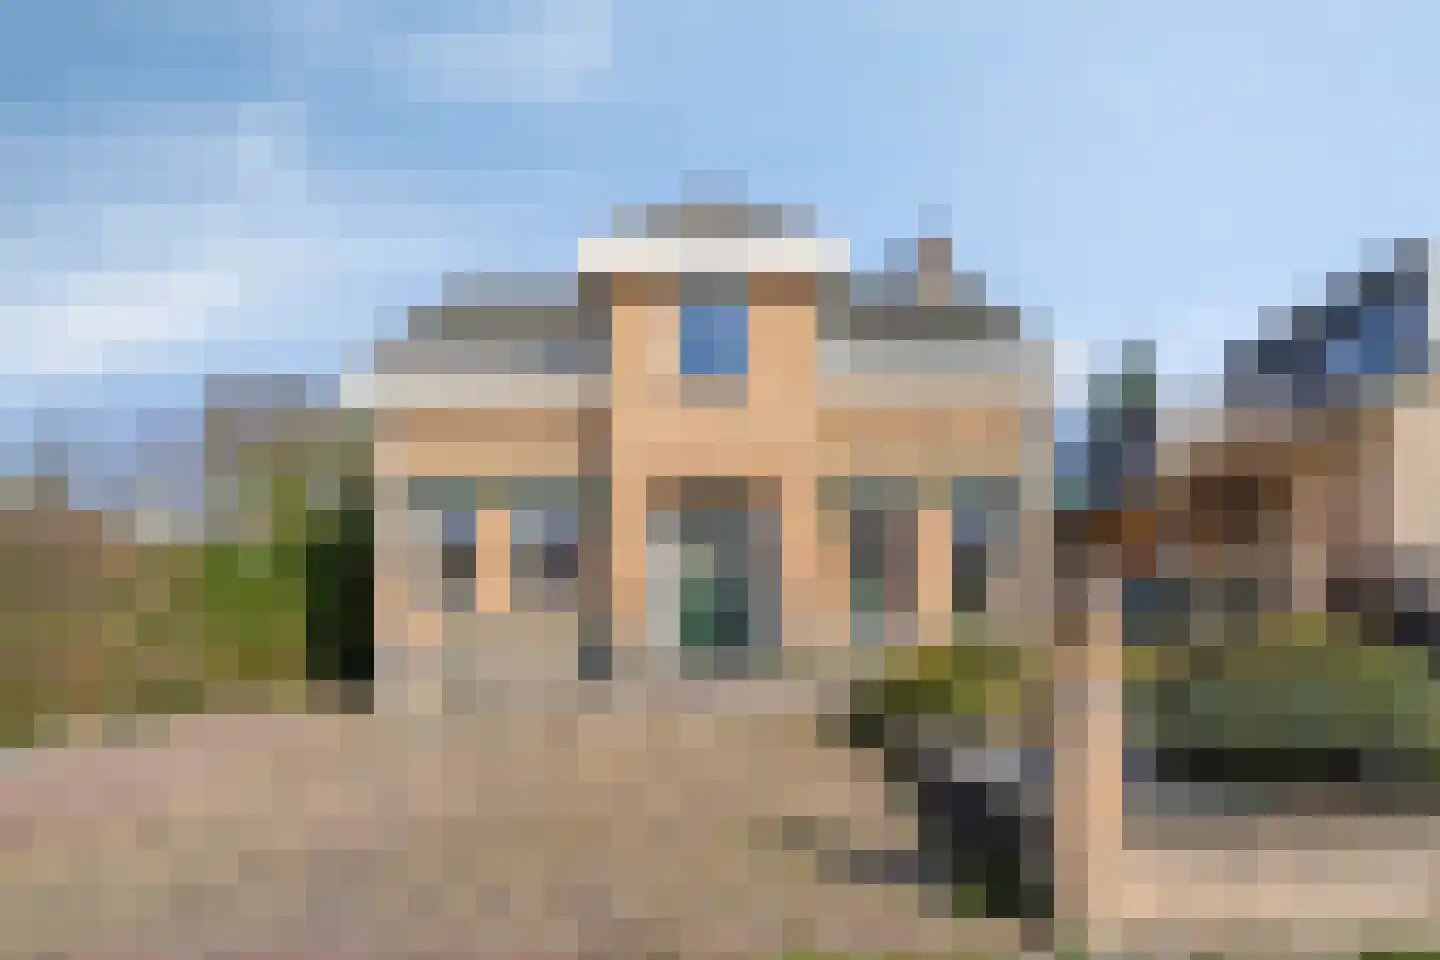
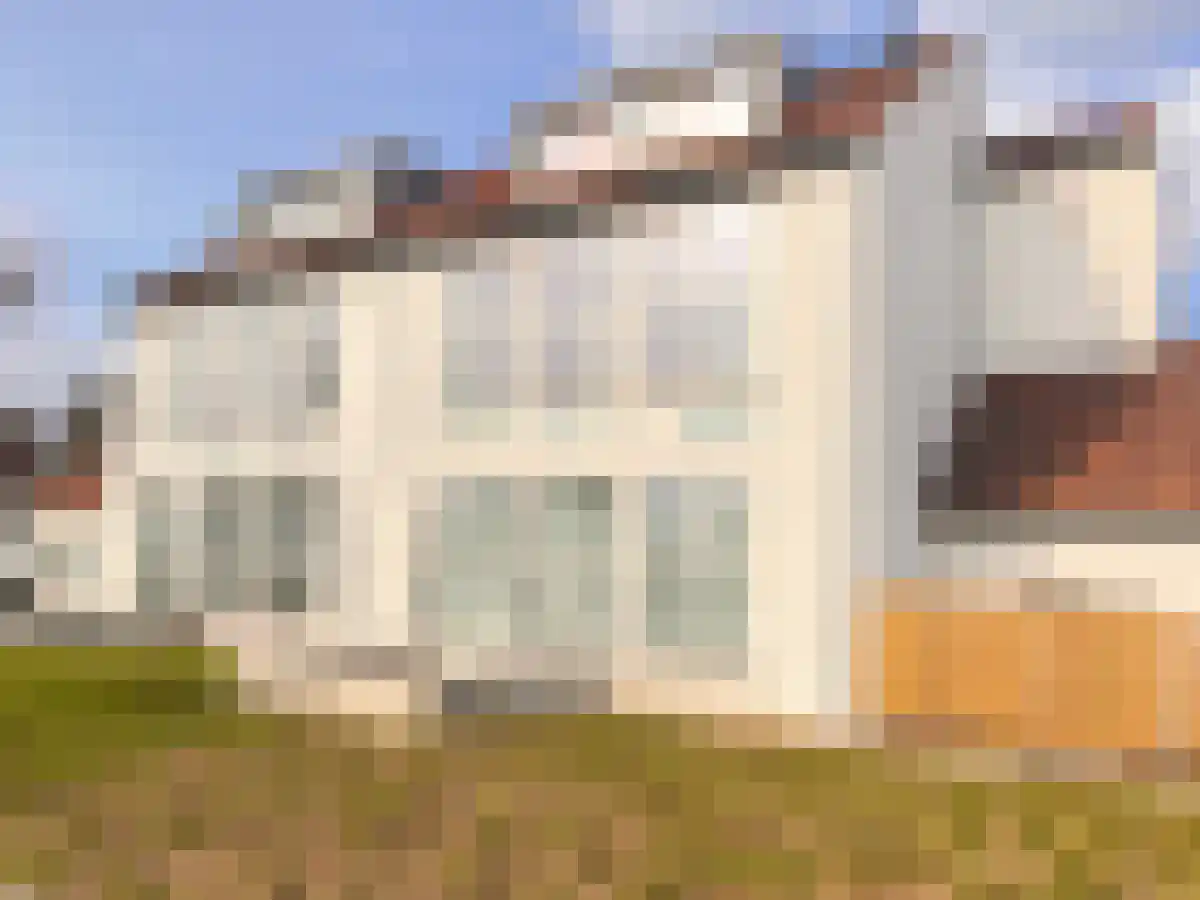
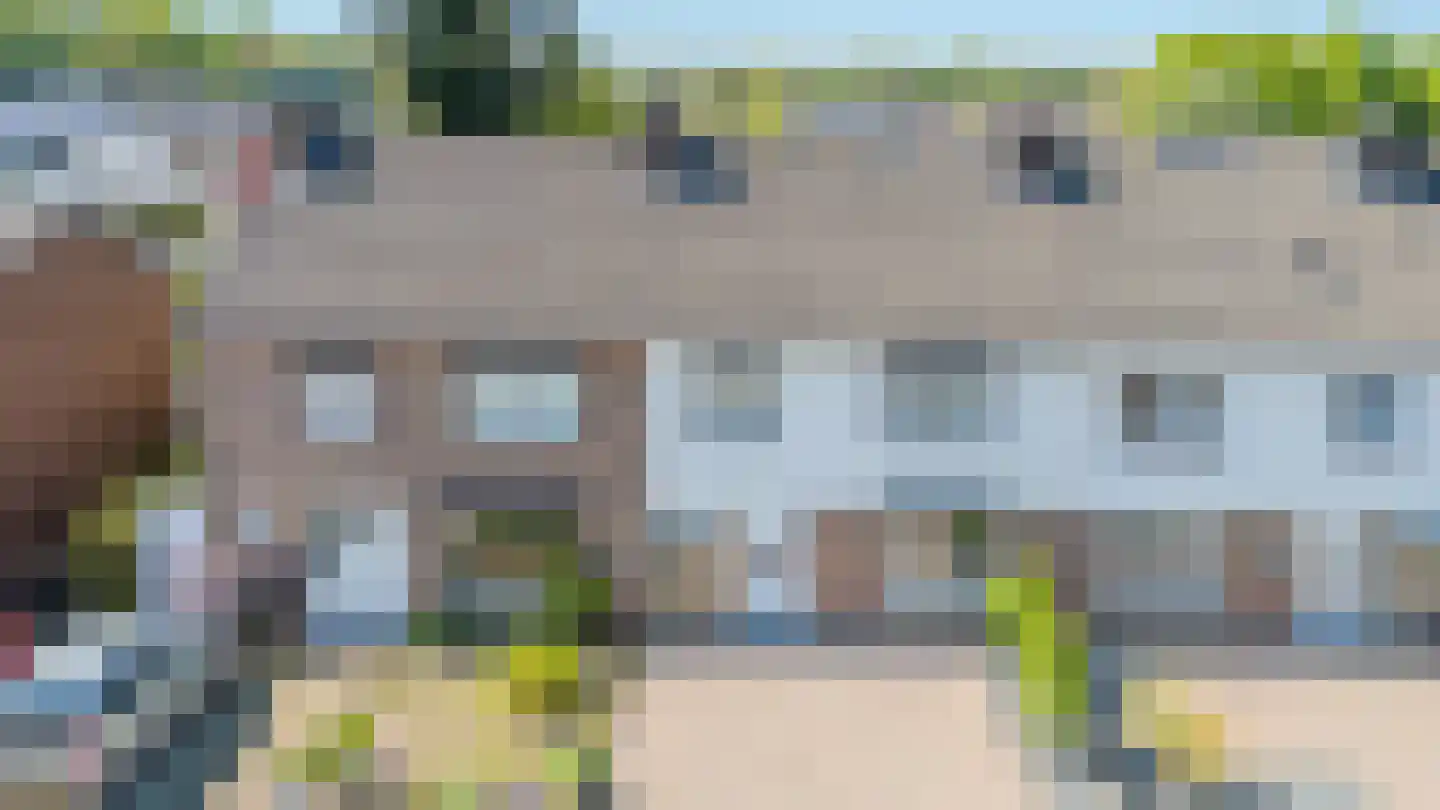
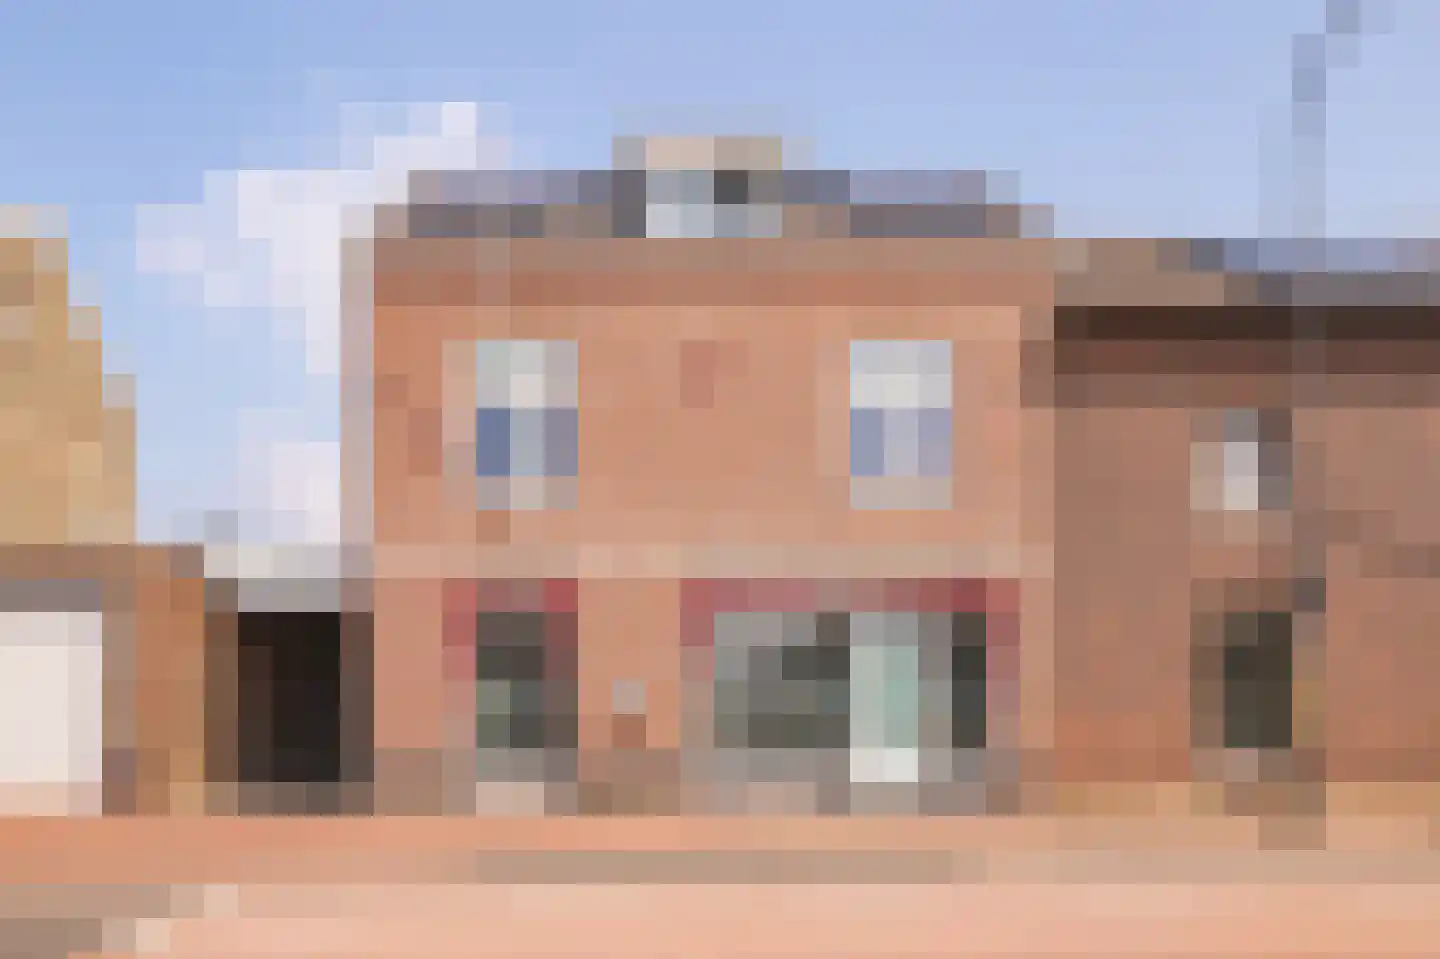
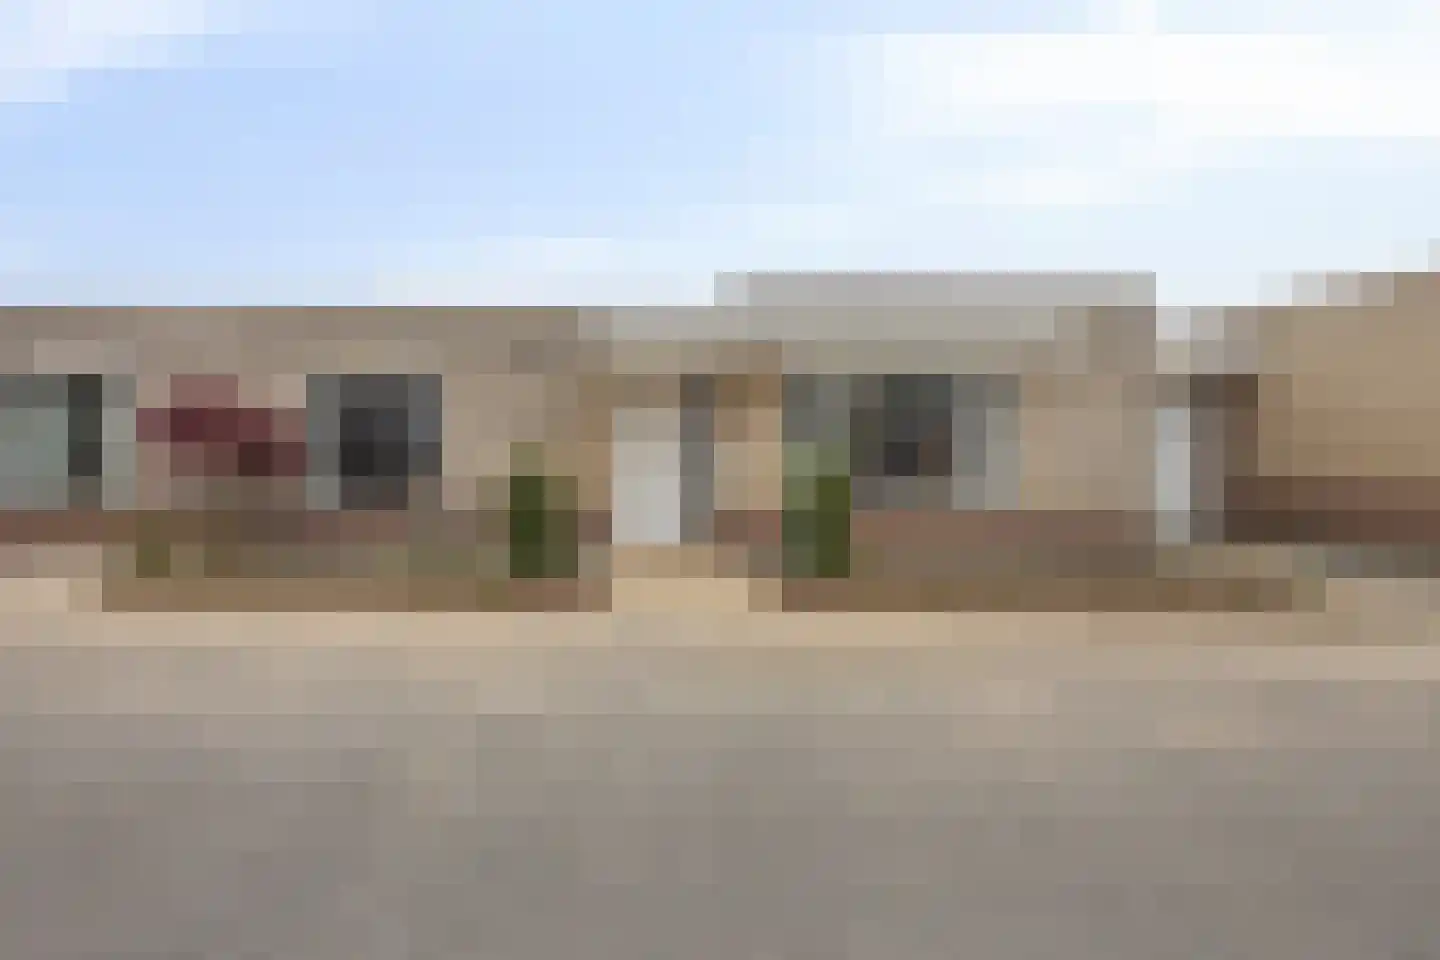
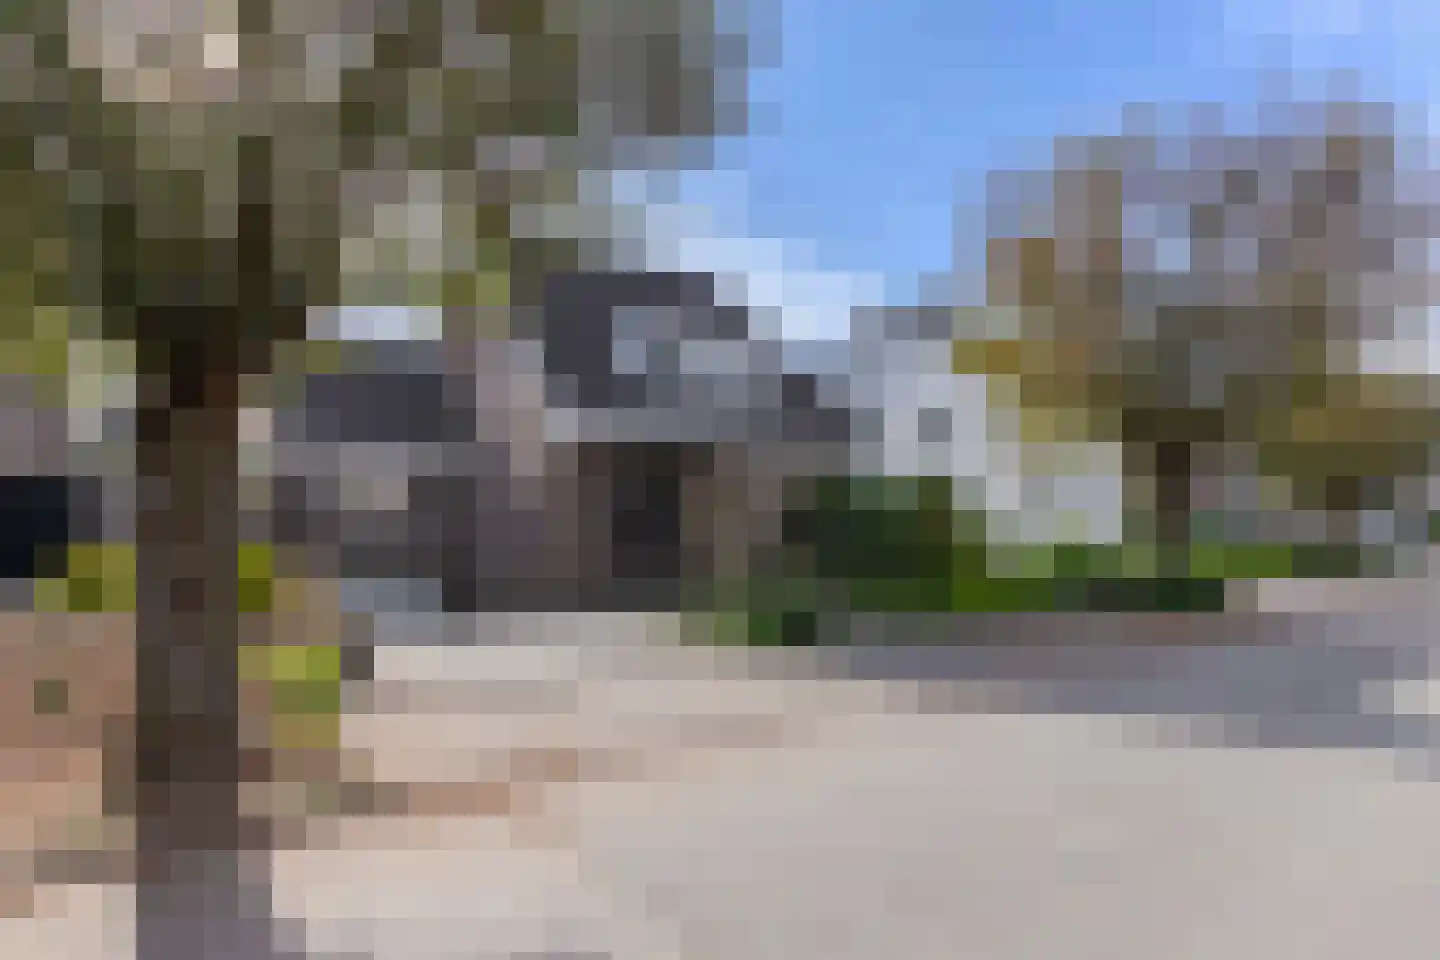
Op de Diéke 3 in Gronsveld biedt deze karaktervolle vrijstaande woning met energielabel A ruime en comfortabele woonplekken, vier slaapkamers en twee badkamers. De woning heeft een royale garage, opslagruimtes en is voorzien van centrale verwarming. Het buiten zijn er een fraai aangelegde tuin met terras en toegang tot het Savelsbos, waarmee deze locatie ideaal is voor rustzoekers en natuurliefhebbers. Dankzij de nabijheid van Maastricht en uitstekende verkeersverbindingen heeft men een perfecte balans tussen landelijke sfeer en gemakken in de buurt.
€ 699.000
Cost of copper (estimated): € 15.830
2% transfer tax (€ 13.980) + notary (€ 1.150) + valuation (€ 700)
Total purchase (incl. p.p.): € 714.830
3,04%
Yearly
€ 34.950
Direct available
Estimated mortgage
Indicative gross monthly cost
Based on annuity and 30 year term
Indicative net monthly cost
iDisclaimer: this mortgage calculation is a simplified indication based on general assumptions. No rights can be derived from the results shown. Calculated with 10-annual interest (zonder NHG), automatically determined based on the price limit € 470.000. Source: 10-jaars rente uit mortgage_rates (05-05-2026 03:45). For non-NHG, an 80% mortgage of the market value has been used in this indication.
2 douches, 2 dubbele wastafels, 2 wastafels, 2 wastafelmeubels, inloopdouche, ligbad, en toilet
Elektrische deur, elektra en stromend water
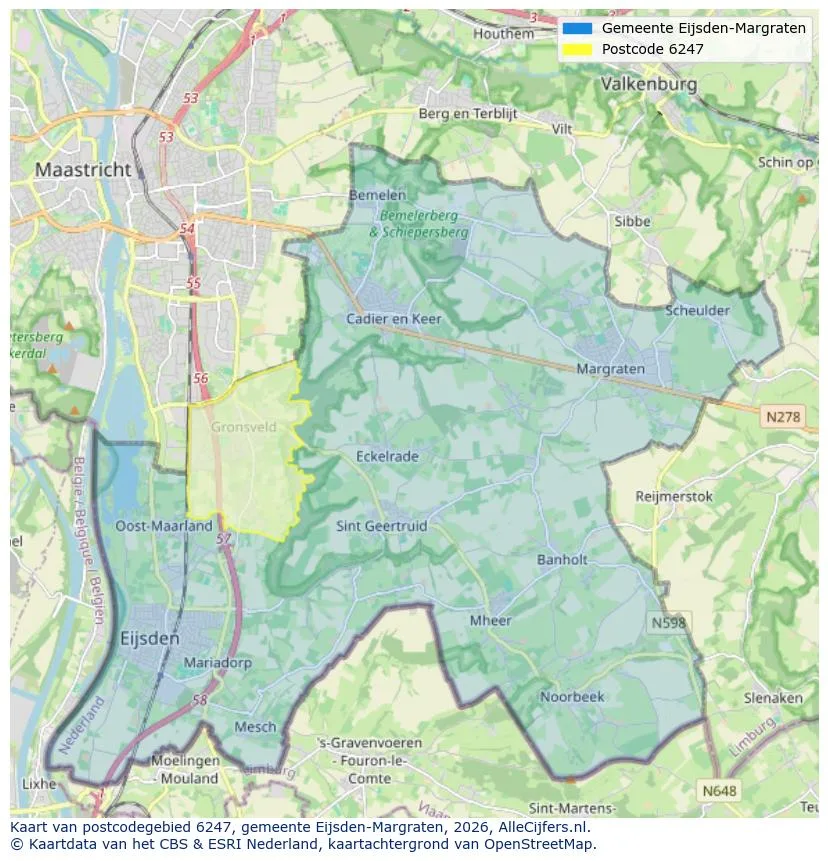
Explore Gronsveld and the surrounding areas
View current location data on residents, WOZ development, housing stock, energy consumption, business activity and safety in Gronsveld. In 2026 were there 3.056 residents. The average WOZ value in 2025 is EUR 386.000.
Residents
3.056
Last year: 2026
Average WOZ
EUR 386.000
Last year: 2025
Average income per person.
EUR 38.600
Source: AllNumbers
Crimes (current year)
89
Total registered
| Year | Residents |
|---|---|
| 2021 | 2.915 |
| 2022 | 2.865 |
| 2023 | 2.845 |
| 2024 | 2.890 |
| 2025 | 2.990 |
| 2026 | 3.056 |
| Year | Average WOZ |
|---|---|
| 2021 | EUR 296.000 |
| 2022 | EUR 309.000 |
| 2023 | EUR 367.000 |
| 2024 | EUR 374.000 |
| 2025 | EUR 386.000 |
Hoger
790
Praktisch
430
Middelbaar
940
Europa
335
Nederland
2.490
Buiten Europa
170
Label C
356
Label B
221
Label D
199
Label F
191
Label A
169
Label G
163
Label A+
83
Label E
76
Label A++
57
Label A+++
35
Label A++++
13
Label A+++++
0
| Year | Gas (m3) | Electricity (kWh) |
|---|---|---|
| 2020 | 1.580 | 3.270 |
| 2021 | 1.820 | 3.290 |
| 2022 | 1.430 | 3.100 |
| 2023 | 1.170 | 2.980 |
| 2024 | 1.110 | 3.050 |
Hoekwoning
Gas: 1.020 • Electricity: 2.840
Huurwoning
Gas: 1.000 • Electricity: 2.130
Koopwoning
Gas: 1.200 • Electricity: 3.160
Appartement
Gas: 1.010 • Electricity: 2.100
Tussenwoning
Gas: 1.030 • Electricity: 2.770
Vrijstaande woning
Gas: 1.440 • Electricity: 3.470
Twee-onder-één-kap woning
Gas: 1.160 • Electricity: 2.980
Total number of company establishments: 420
| Period | Crimes |
|---|---|
| jan 2026 | 7 |
| jul 2025 | 14 |
| jun 2025 | 10 |
| mei 2025 | 7 |
| mrt 2025 | 5 |
| mrt 2026 | 7 |
| nov 2024 | 4 |
| nov 2025 | 8 |
| okt 2024 | 13 |
| okt 2025 | 7 |
| sep 2024 | 6 |
| sep 2025 | 3 |
These figures give an indicative picture of safety trends in the living environment of Gronsveld.
Short answers based on current local statistics, handy for a quick comparison of the living environment.
Gronsveld telt in 2026 ongeveer 3.056 inwoners.
De gemiddelde WOZ-waarde in Gronsveld is in 2025 circa € 386.000.
Het gemiddelde inkomen per inwoner in Gronsveld ligt rond € 38.600 per jaar.
Voor het huidige jaar gaat het om ongeveer 89 geregistreerde misdrijven. Gebruik deze cijfers als indicatie en vergelijk trends per periode.
In Gronsveld komt vooral "Tussenwoningen" veel voor, met ongeveer 413 woningen.
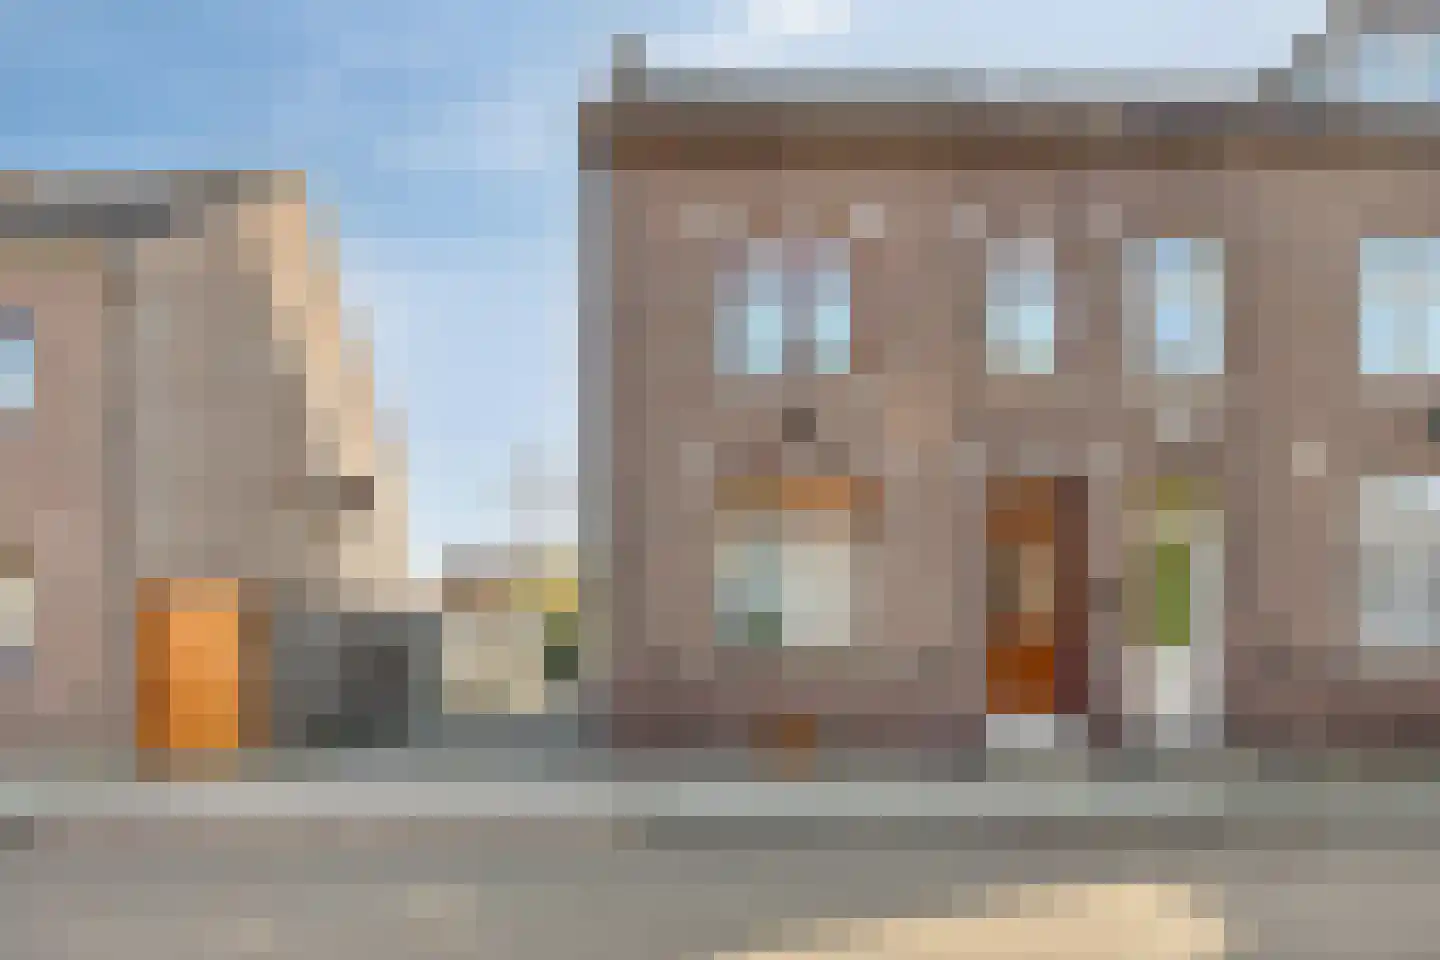
View more homes in this location.

6247AC Gronsveld
€ 1.950.000 k.k.
€ 2.600/m²

6247AC Gronsveld
€ 850.000 k.k.
€ 2.576/m²
6247AR Gronsveld
€ 1.195 p/m
€ 16/m²
6247BS Gronsveld
€ 335.000 k.k.
€ 2.888/m²
6247AC Gronsveld
€ 839.000 k.k.
€ 2.806/m²
6247JA Gronsveld
€ 569.000 k.k.
€ 5.220/m²
6247EG Gronsveld
€ 725.000 k.k.
€ 2.877/m²
6247BV Gronsveld
€ 439.000 k.k.
€ 3.228/m²
