Residents
168.946
Last year: 2026
2011CG Haarlem • Noord-Holland
€ 385.000 k.k.
Cost of copper (estimated): € 9.550
2% transfer tax (€ 7.700) + notary (€ 1.150) + valuation (€ 700)
Total incl. VAT: € 394.550
Purchase price /m²: € 8.750
Spaarne 71 A in Haarlem biedt een zeer lichte 2-kamer hoekappartement met terras en prachtig uitzicht over het Spaarne. Het moderne appartement is voorzien van nieuw schilderwerk, massief eiken vloeren en heeft de hele dag zon. De woonkamer en slaapkamer bieden toegang tot een loggia, met een knus terras uitkerend in de royale ruimtes. Inclusief berging op de parterre, moderne keuken, badkamer met inloopdouche en wasmachine/-drogeraansluiting, ligt het appartement centraal tegenover faciliteiten zoals winkels en openbaar vervoer. Het NS-station is op loopafstand en uitvalswegen worden snel bereikt. De VVE wordt gewaardeerd voor zijn gezondheid, met servicekosten van €130,- per maand. Fietsen naar de duinen van Zandvoort is mogelijk vanwege deze superieur ligging in het historische stadscentrum Haarlem.
€ 385.000
Cost of copper (estimated): € 9.550
2% transfer tax (€ 7.700) + notary (€ 1.150) + valuation (€ 700)
Total purchase (incl. p.p.): € 394.550
2,78%
Yearly
€ 19.250
Direct available
Estimated mortgage
Indicative gross monthly cost
Based on annuity and 30 year term
Indicative net monthly cost
iDisclaimer: this mortgage calculation is a simplified indication based on general assumptions. No rights can be derived from the results shown. Calculated with 10-annual interest (met NHG), automatically determined based on the price limit € 470.000. Source: 10-jaars rente uit mortgage_rates (23-04-2026 08:38).
Douche, toilet, en wastafelmeubel
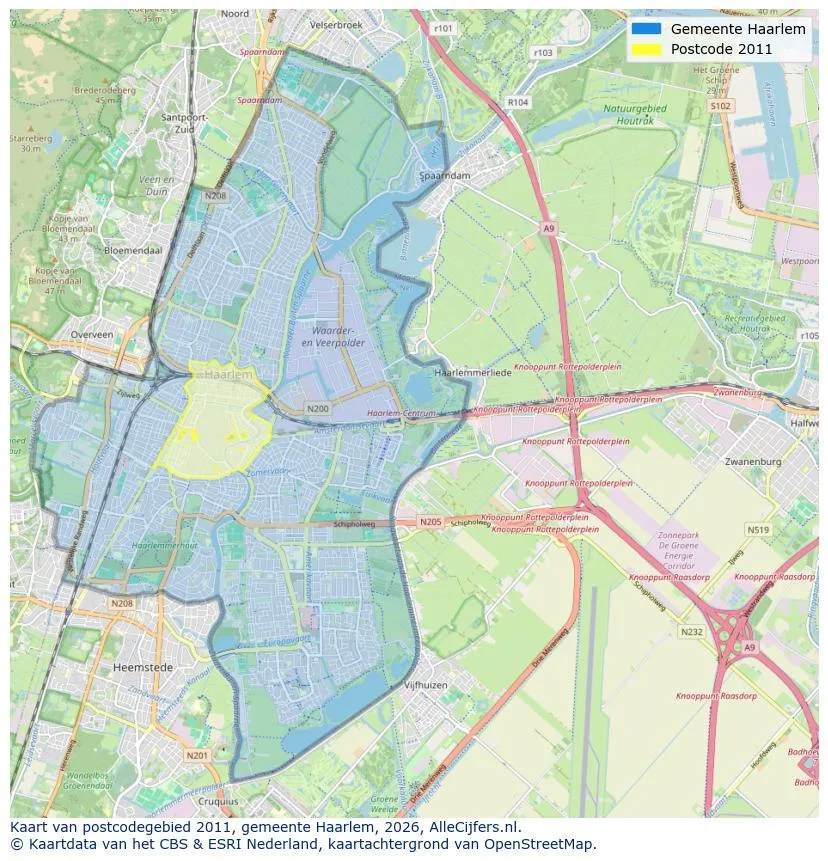
Spatial overview of the work area in Haarlem
View current location data on residents, WOZ development, housing stock, energy consumption, business activity and safety in Haarlem. In 2026 were there 168.946 residents. The average WOZ value in 2025 is EUR 505.000.
Residents
168.946
Last year: 2026
Average WOZ
EUR 505.000
Last year: 2025
Average income per person.
EUR 39.300
Source: AllNumbers
Crimes (current year)
9.383
Total registered
| Year | Residents |
|---|---|
| 2022 | 162.898 |
| 2023 | 165.396 |
| 2024 | 167.636 |
| 2025 | 168.743 |
| 2026 | 168.946 |
| Year | Average WOZ |
|---|---|
| 2021 | EUR 380.000 |
| 2022 | EUR 417.000 |
| 2023 | EUR 479.000 |
| 2024 | EUR 483.000 |
| 2025 | EUR 505.000 |
Hoger
45
Praktisch
22
Middelbaar
33
Europa
22.013
Nederland
105.573
Buiten Europa
41.157
Label C
16.311
Label A
16.043
Label F
11.811
Label G
10.233
Label B
8.296
Label E
8.020
Label D
7.483
Label A+++
1.955
Label A++
1.470
Label A+
1.442
Label A++++
138
Label A+++++
16
| Year | Gas (m3) | Electricity (kWh) |
|---|---|---|
| 2020 | 1.080 | 2.390 |
| 2021 | 1.220 | 2.450 |
| 2022 | 960 | 2.280 |
| 2023 | 840 | 2.140 |
| 2024 | 800 | 2.160 |
Hoekwoning
Gas: 1.110 • Electricity: 2.580
Huurwoning
Gas: 710 • Electricity: 1.800
Koopwoning
Gas: 950 • Electricity: 2.430
Appartement
Gas: 670 • Electricity: 1.800
Tussenwoning
Gas: 950 • Electricity: 2.400
Vrijstaande woning
Gas: 1.700 • Electricity: 4.040
Twee-onder-één-kap woning
Gas: 1.480 • Electricity: 3.310
Total number of company establishments: 28.865
| Period | Crimes |
|---|---|
| jan 2025 | 720 |
| jan 2026 | 752 |
| jul 2025 | 814 |
| jun 2025 | 842 |
| mei 2025 | 894 |
| mrt 2025 | 813 |
| nov 2024 | 773 |
| nov 2025 | 709 |
| okt 2024 | 880 |
| okt 2025 | 776 |
| sep 2024 | 777 |
| sep 2025 | 800 |
These figures give an indicative picture of safety trends in the living environment of Haarlem.
Short answers based on current local statistics, handy for a quick comparison of the living environment.
Haarlem telt in 2026 ongeveer 168.946 inwoners.
De gemiddelde WOZ-waarde in Haarlem is in 2025 circa € 505.000.
Het gemiddelde inkomen per inwoner in Haarlem ligt rond € 39.300 per jaar.
Voor het huidige jaar gaat het om ongeveer 9.383 geregistreerde misdrijven. Gebruik deze cijfers als indicatie en vergelijk trends per periode.
In Haarlem komt vooral "Appartementen" veel voor, met ongeveer 46.092 woningen.
View more homes in this location.

2012CB Haarlem
€ 2.650 p/m
€ 31/m²
2033ES Haarlem
€ 2.550 p/m
€ 30/m²
2033HB Haarlem
€ 2.000 p/m
€ 33/m²
2035BK Haarlem
€ 448.000 k.k.
2026XJ Haarlem
€ 350.000 k.k.
2011JJ Haarlem
€ 265.000 k.k.

2013ER Haarlem
€ 2.375 p/m
€ 26/m²
2032KM Haarlem
€ 500.000 k.k.
€ 5.682/m²
