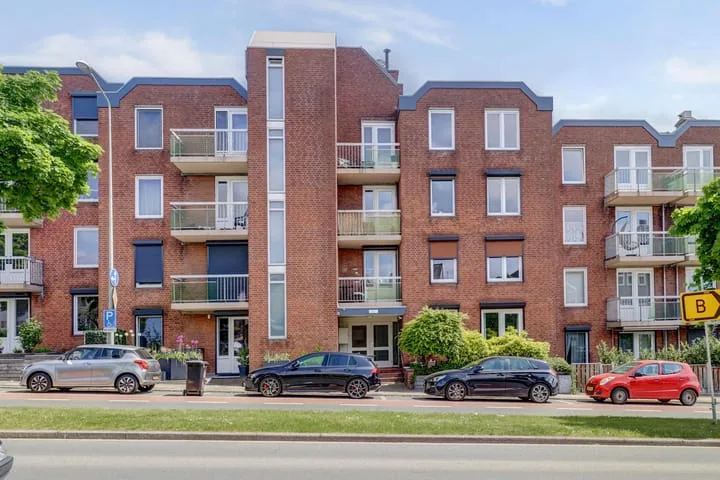
- Sold
Drieoortsput 128
6417PP Heerlen
€ 199.000 k.k.
€ 2.618/m²
- Living area
- 76 m²
- Land area
- —
- Bedrooms
- 1
View 603 sold houses in Heerlen
Type to search. Use arrow down and arrow up to navigate through results and press Enter to open.
Hidden search suggestions.
Compare sold homes in Heerlen or view the current offering in this location directly.
On this page you will find recently sold homes in Heerlen. Use this overview to better estimate selling prices, popular neighborhoods, and the local housing supply before you choose a real estate agent. Also view the current housing supply with 929 houses in Heerlen.
6417PP Heerlen
€ 199.000 k.k.
€ 2.618/m²
6419XJ Heerlen
€ 225.000 k.k.
€ 2.142/m²
6414HN Heerlen
€ 309.000 k.k.
€ 2.971/m²
6411ES Heerlen
€ 349.000 k.k.
€ 3.673/m²
6412TM Heerlen
€ 195.000 k.k.
€ 2.119/m²
6414HW Heerlen
€ 275.000 k.k.
€ 2.619/m²
6413TS Heerlen
€ 169.000 k.k.
€ 1.690/m²
6418TL Heerlen
€ 349.000 k.k.
€ 2.748/m²
6412PW Heerlen
€ 385.000 k.k.
€ 2.333/m²
6412DS Heerlen
€ 190.000 k.k.
€ 2.289/m²
6413ET Heerlen
€ 149.000 k.k.
€ 2.403/m²
6416BE Heerlen
€ 195.000 k.k.
€ 2.708/m²
6418AJ Heerlen
€ 235.000 k.k.
€ 2.350/m²
6411MC Heerlen
€ 185.000 k.k.
€ 2.176/m²
6411MH Heerlen
€ 152.500 k.k.
€ 2.541/m²
6411VC Heerlen
€ 200.000 k.k.
€ 1.960/m²
6417RC Heerlen
€ 150.000 k.k.
€ 2.343/m²
6417RC Heerlen
€ 165.000 k.k.
€ 2.619/m²
6411GT Heerlen
€ 235.000 k.k.
€ 2.764/m²
6417BV Heerlen
€ 499.500 k.k.
€ 3.727/m²
6419XT Heerlen
€ 269.000 k.k.
€ 3.280/m²
6414RN Heerlen
€ 298.000 k.k.
€ 2.950/m²
6413EA Heerlen
€ 279.000 k.k.
€ 1.978/m²
6413CS Heerlen
€ 165.000 k.k.
€ 2.462/m²
6413KV Heerlen
€ 225.000 k.k.
€ 2.295/m²
6412ZX Heerlen
€ 290.000 k.k.
€ 2.660/m²
6411AK Heerlen
€ 225.000 k.k.
€ 2.205/m²
6411AN Heerlen
€ 198.000 k.k.
€ 1.767/m²
Get free quotes from realtors with local market knowledge in Heerlen.
Selling a home in Heerlen? Compare real estate agents who know the local housing market. Also check out all real estate agents in Heerlen or the top 10 real estate agents in Heerlen for extra context for your choice.
By comparing brokers and requesting quotes
Short answers about housing prices, sold homes and comparing real estate agents in Heerlen.
The costs of a real estate agent in Heerlen vary per office, property type and sales approach. Therefore, compare multiple quotes and also look at the real estate agents in Heerlen to better compare rates, presentation and local experience.
On this page we currently show 603 sold houses in Heerlen from our selection. This helps you to better assess recent transactions and the local housing market.
Houses sold in Heerlen give insight into asking prices, house types and neighborhoods where recent transactions have taken place. Compare this also with the current housing stock in Heerlen to better understand the market.
You can use sold homes as a first market indication, but a local real estate agent can better take into account finishing, location, maintenance and current demand in Heerlen.
Compare realtors in Heerlen on local sales experience, reviews, expected yield, commission and marketing approach. The top 10 realtors in Heerlen helps to quickly discover strong offices.
View current location data on residents, WOZ development, housing stock, energy consumption, business activity and safety in Heerlen. In 2026 were there 69.029 residents. The average WOZ value in 2025 is EUR 218.029.
These figures help to better assess and compare the housing stock in Heerlen with recent sold homes. Orient yourself then on suitable top real estate agents in Heerlen for sales advice in this region.
Residents
69.029
Last year: 2026
Average WOZ
EUR 218.029
Last year: 2025
Average income per person.
EUR 29.202
Source: AllNumbers
Crimes (current year)
4.829
Total registered
| Year | Residents |
|---|---|
| 2021 | 68.002 |
| 2022 | 67.963 |
| 2023 | 68.283 |
| 2024 | 68.638 |
| 2025 | 68.815 |
| 2026 | 69.029 |
| Year | Average WOZ |
|---|---|
| 2021 | EUR 161.327 |
| 2022 | EUR 173.225 |
| 2023 | EUR 205.872 |
| 2024 | EUR 203.030 |
| 2025 | EUR 218.029 |
Hoger
12.893
Praktisch
16.908
Middelbaar
21.848
Europa
11.090
Nederland
45.575
Buiten Europa
12.160
Label C
10.659
Label A
5.993
Label B
5.625
Label D
4.213
Label E
3.598
Label F
3.468
Label G
3.286
Label A+
727
Label A++
255
Label A+++
178
Label A++++
55
Label A+++++
9
| Year | Gas (m3) | Electricity (kWh) |
|---|---|---|
| 2020 | 1.080 | 2.557 |
| 2021 | 1.218 | 2.591 |
| 2022 | 957 | 2.476 |
| 2023 | 810 | 2.376 |
| 2024 | 782 | 2.391 |
Hoekwoning
Gas: 1.013 • Electricity: 2.728
Huurwoning
Gas: 708 • Electricity: 2.003
Koopwoning
Gas: 908 • Electricity: 2.784
Appartement
Gas: 591 • Electricity: 1.777
Tussenwoning
Gas: 888 • Electricity: 2.552
Vrijstaande woning
Gas: 1.472 • Electricity: 3.817
Twee-onder-één-kap woning
Gas: 1.124 • Electricity: 2.986
Total number of company establishments: 7.095
| Period | Crimes |
|---|---|
| jan 2026 | 341 |
| jul 2025 | 411 |
| jun 2025 | 429 |
| mei 2025 | 382 |
| mrt 2025 | 411 |
| mrt 2026 | 432 |
| nov 2024 | 419 |
| nov 2025 | 455 |
| okt 2024 | 452 |
| okt 2025 | 434 |
| sep 2024 | 422 |
| sep 2025 | 389 |
These figures give an indicative picture of safety trends in the living environment of Heerlen.
Short answers based on current local statistics, handy for a quick comparison of the living environment.
Heerlen telt in 2026 ongeveer 69.029 inwoners.
De gemiddelde WOZ-waarde in Heerlen is in 2025 circa € 218.029.
Het gemiddelde inkomen per inwoner in Heerlen ligt rond € 29.202 per jaar.
Voor het huidige jaar gaat het om ongeveer 4.829 geregistreerde misdrijven. Gebruik deze cijfers als indicatie en vergelijk trends per periode.
In Heerlen komt vooral "Appartementen" veel voor, met ongeveer 15.001 woningen.