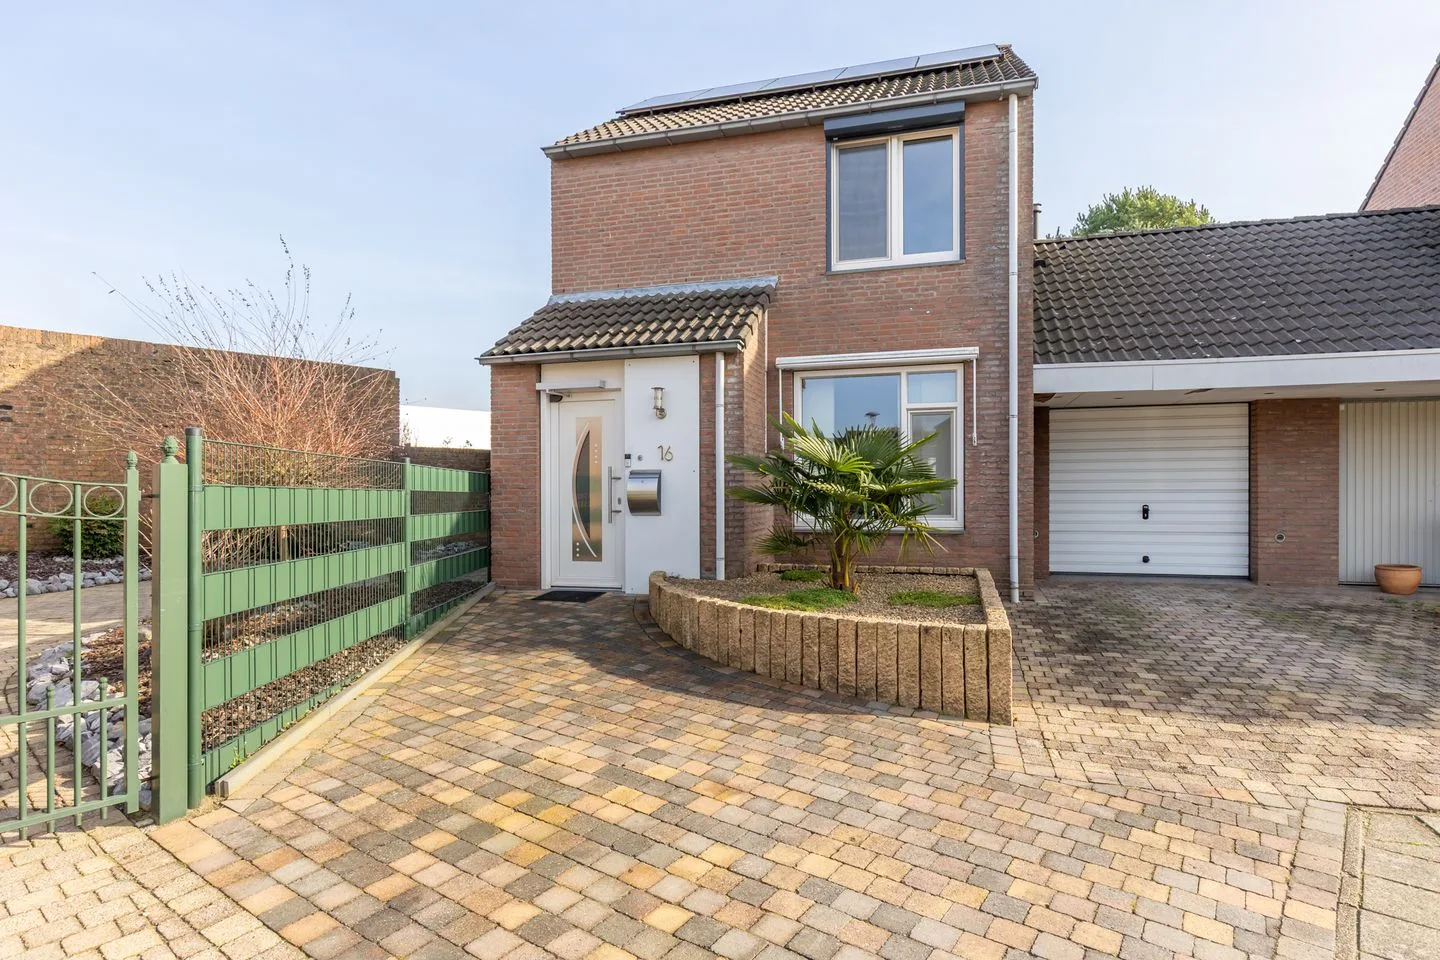
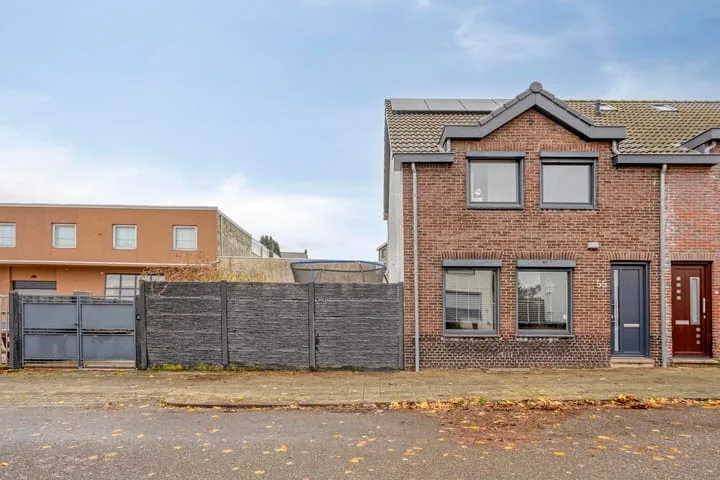
- Sold
Oranjestraat 9
6433JM Hoensbroek
€ 239.000 k.k.
€ 2.716/m²
- Living area
- 88 m²
- Land area
- 127 m²
- Bedrooms
- 4
Searching in 239 houses in Hoensbroek
Type to search. Use arrow down and arrow up to navigate through results and press Enter to open.
Hidden search suggestions.
View current properties in Hoensbroek or search targeted on street, postal code and property characteristics.
View the current housing stock in Hoensbroek and quickly filter by price, living area, rooms and more. There are currently 239 houses in this place within our selection. View also 167 sold houses in Hoensbroek for extra insight into the local housing market.
6433JM Hoensbroek
€ 239.000 k.k.
€ 2.716/m²
6433EX Hoensbroek
€ 389.000 k.k.
€ 3.297/m²
6433CD Hoensbroek
€ 199.000 k.k.
€ 2.426/m²
6431EZ Hoensbroek
€ 470.000 k.k.
€ 2.938/m²
6432EX Hoensbroek
€ 295.000 k.k.
€ 3.138/m²
6433BH Hoensbroek
€ 345.000 k.k.
€ 2.555/m²
6433DE Hoensbroek
€ 495.000 k.k.
€ 3.193/m²
6431AJ Hoensbroek
€ 229.000 k.k.
€ 1.974/m²
6431EW Hoensbroek
€ 299.500 k.k.
€ 2.415/m²
6432DG Hoensbroek
€ 210.000 k.k.
€ 2.100/m²
6431TA Hoensbroek
€ 279.000 k.k.
€ 2.306/m²
6433CJ Hoensbroek
€ 199.500 k.k.
€ 2.525/m²
6431ED Hoensbroek
€ 219.000 k.k.
€ 3.000/m²
6431VP Hoensbroek
€ 225.000 k.k.
€ 1.875/m²
6431BM Hoensbroek
€ 175.000 k.k.
€ 2.083/m²
6432EA Hoensbroek
€ 319.000 k.k.
€ 3.127/m²
6432AG Hoensbroek
€ 179.000 k.k.
€ 2.265/m²
6431GW Hoensbroek
€ 295.000 k.k.
€ 1.049/m²
6433BE Hoensbroek
€ 295.000 k.k.
€ 2.864/m²
6431CL Hoensbroek
€ 250.000 k.k.
€ 2.173/m²
6431HG Hoensbroek
€ 150.000 k.k.
€ 1.648/m²
6431GC Hoensbroek
€ 389.000 k.k.
€ 2.992/m²
6431TL Hoensbroek
€ 229.000 k.k.
€ 2.201/m²
6432AP Hoensbroek
€ 323.000 k.k.
€ 2.909/m²
6432DL Hoensbroek
€ 389.000 k.k.
€ 2.860/m²
6432AS Hoensbroek
€ 175.000 k.k.
€ 2.822/m²
6433JG Hoensbroek
€ 299.000 k.k.
€ 2.214/m²
6432AH Hoensbroek
€ 325.000 k.k.
€ 2.519/m²
Get free quotes from real estate agents with local market knowledge. Compare more than 97 real estate agents in Hoensbroek.
Selling a home in Hoensbroek? Compare all real estate agents in Hoensbroek or view the top 10 real estate agents in Hoensbroek for extra context for your choice.
Real estate agents make sharper offers when they know you're comparing — ask for quotes for sale or purchase.
Practical answers about housing supply, sales and comparing real estate agents in Hoensbroek.
The costs of a real estate agent in Hoensbroek depend on commission, setup costs, property presentation and the chosen service. Compare the 97 real estate agents in Hoensbroek via the real estate agent page and request multiple quotes to compare rates and approach well.
Within our selection, we are currently showing 239 houses in Hoensbroek. View also the sold houses in Hoensbroek to compare the current offering with recent transactions.
Take into account not only price and living area but also maintenance, energy label, location, outdoor space and sales status. This way you compare houses in Hoensbroek on more than just the asking price.
A local real estate agent knows the neighborhoods, recent transactions and demand in Hoensbroek. By comparing 97 real estate agents in the region you get a better insight into prices, sales strategy and expected yield; the top 10 in Hoensbroek provides a useful starting point.
Yes, when making a sales plan, a valuation in Hoensbroek is wise. You gain insight into a realistic asking price and can then compare offers from real estate agents specifically.
View current location data on residents, WOZ development, housing stock, energy consumption, business activity and safety in Hoensbroek. In 2026 were there 18.708 residents. The average WOZ value in 2025 is EUR 200.122.
These figures help to better assess and compare the housing stock in Hoensbroek with recent sold homes. Orient yourself then on suitable top real estate agents in Hoensbroek for sales advice in this region.
Residents
18.708
Last year: 2026
Average WOZ
EUR 200.122
Last year: 2025
Average income per person.
EUR 27.990
Source: AllNumbers
Crimes (current year)
1.004
Total registered
| Year | Residents |
|---|---|
| 2021 | 18.871 |
| 2022 | 18.826 |
| 2023 | 18.780 |
| 2024 | 18.786 |
| 2025 | 18.700 |
| 2026 | 18.708 |
| Year | Average WOZ |
|---|---|
| 2021 | EUR 151.559 |
| 2022 | EUR 160.700 |
| 2023 | EUR 190.615 |
| 2024 | EUR 185.886 |
| 2025 | EUR 200.122 |
Hoger
2.538
Praktisch
5.579
Middelbaar
5.993
Europa
2.885
Nederland
13.180
Buiten Europa
2.635
Label C
2.728
Label E
1.374
Label B
1.367
Label F
1.353
Label D
1.274
Label A
1.092
Label G
1.009
Label A+
62
Label A+++
48
Label A++++
28
Label A++
16
Label A+++++
2
| Year | Gas (m3) | Electricity (kWh) |
|---|---|---|
| 2020 | 1.173 | 2.668 |
| 2021 | 1.312 | 2.685 |
| 2022 | 1.026 | 2.586 |
| 2023 | 859 | 2.485 |
| 2024 | 833 | 2.535 |
Hoekwoning
Gas: 943 • Electricity: 2.778
Huurwoning
Gas: 778 • Electricity: 2.082
Koopwoning
Gas: 951 • Electricity: 2.936
Appartement
Gas: 710 • Electricity: 1.858
Tussenwoning
Gas: 816 • Electricity: 2.535
Vrijstaande woning
Gas: 1.372 • Electricity: 3.669
Twee-onder-één-kap woning
Gas: 1.050 • Electricity: 2.979
Total number of company establishments: 1.495
| Period | Crimes |
|---|---|
| jan 2026 | 85 |
| jul 2025 | 73 |
| jun 2025 | 84 |
| mei 2025 | 102 |
| mrt 2025 | 84 |
| mrt 2026 | 66 |
| nov 2024 | 76 |
| nov 2025 | 74 |
| okt 2024 | 73 |
| okt 2025 | 87 |
| sep 2024 | 64 |
| sep 2025 | 66 |
These figures give an indicative picture of safety trends in the living environment of Hoensbroek.
Short answers based on current local statistics, handy for a quick comparison of the living environment.
Hoensbroek telt in 2026 ongeveer 18.708 inwoners.
De gemiddelde WOZ-waarde in Hoensbroek is in 2025 circa € 200.122.
Het gemiddelde inkomen per inwoner in Hoensbroek ligt rond € 27.990 per jaar.
Voor het huidige jaar gaat het om ongeveer 1.004 geregistreerde misdrijven. Gebruik deze cijfers als indicatie en vergelijk trends per periode.
In Hoensbroek komt vooral "Tussenwoningen" veel voor, met ongeveer 3.477 woningen.