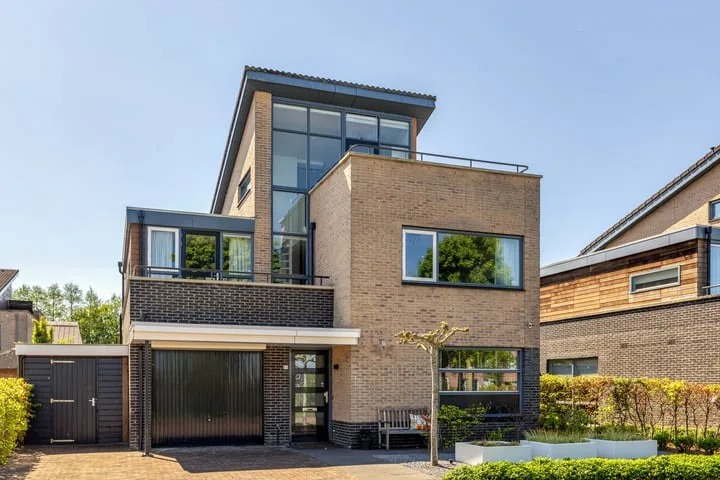
- Sold
Julianalaan 47
3871VG Hoevelaken
€ 450.000 k.k.
€ 3.571/m²
- Living area
- 126 m²
- Land area
- 168 m²
- Bedrooms
- 4
View 91 sold houses in Hoevelaken
Type to search. Use arrow down and arrow up to navigate through results and press Enter to open.
Hidden search suggestions.
Compare sold homes in Hoevelaken or view the current offering in this location directly.
On this page you will find recently sold homes in Hoevelaken. Use this overview to better estimate selling prices, popular neighborhoods, and the local housing supply before you choose a real estate agent. Also view the current housing supply with 124 houses in Hoevelaken.
3871VG Hoevelaken
€ 450.000 k.k.
€ 3.571/m²
3871CN Hoevelaken
€ 475.000 k.k.
€ 3.740/m²
3871VC Hoevelaken
€ 595.000 k.k.
€ 4.020/m²
3871JZ Hoevelaken
€ 895.000 k.k.
€ 5.295/m²
3871KN Hoevelaken
€ 2.000.000 k.k.
€ 5.602/m²
3871DB Hoevelaken
€ 485.000 k.k.
€ 3.129/m²
3871XB Hoevelaken
€ 875.000 k.k.
€ 5.401/m²
Bekijk recente verkopen en ontvang gratis offertes van lokale verkoopmakelaars in Hoevelaken.
Recent verkocht in Hoevelaken? Lees de verkoopgerichte gids huis verkopen in Hoevelaken, vergelijk verkoopmakelaars in Hoevelaken of bekijk de beste verkoopmakelaars in Hoevelaken voor referentie bij jouw keuze.
Makelaars maken scherpere voorstellen als ze weten dat je vergelijkt — vraag offertes aan voor verkoop of aankoop.
Short answers about housing prices, sold homes and comparing real estate agents in Hoevelaken.
The costs of a real estate agent in Hoevelaken vary per office, property type and sales approach. Therefore, compare multiple quotes and also look at the real estate agents in Hoevelaken to better compare rates, presentation and local experience.
On this page we currently show 91 sold houses in Hoevelaken from our selection. This helps you to better assess recent transactions and the local housing market.
Houses sold in Hoevelaken give insight into asking prices, house types and neighborhoods where recent transactions have taken place. Compare this also with the current housing stock in Hoevelaken to better understand the market.
Je kunt verkochte woningen gebruiken als eerste marktindicatie, maar een lokale makelaar kan beter rekening houden met afwerking, ligging, onderhoud en actuele vraag in Hoevelaken. Plan de volgende stap via de gids huis verkopen in Hoevelaken.
Vergelijk makelaars in Hoevelaken op lokale verkoopervaring, reviews, verwachte opbrengst, courtage en marketingaanpak. Bekijk verkoopmakelaars in Hoevelaken of de top 10 makelaars in Hoevelaken om snel sterke kantoren te ontdekken.
View current location data on residents, WOZ development, housing stock, energy consumption, business activity and safety in Hoevelaken. In 2025 were there 9.800 residents. The average WOZ value in 2025 is EUR 523.000.
These figures help to better assess and compare the housing stock in Hoevelaken with recent sold homes. Orient yourself then on suitable top real estate agents in Hoevelaken for sales advice in this region.
Residents
9.800
Last year: 2025
Average WOZ
EUR 523.000
Last year: 2025
Average income per person.
EUR 37.000
Source: AllNumbers
Crimes (current year)
161
Total registered
| Year | Residents |
|---|---|
| 2021 | 9.575 |
| 2022 | 9.745 |
| 2023 | 9.820 |
| 2024 | 9.800 |
| 2025 | 9.800 |
| Year | Average WOZ |
|---|---|
| 2021 | EUR 383.000 |
| 2022 | EUR 418.000 |
| 2023 | EUR 475.000 |
| 2024 | EUR 505.000 |
| 2025 | EUR 523.000 |
Hoger
2.580
Praktisch
1.590
Middelbaar
2.810
Europa
375
Nederland
8.585
Buiten Europa
835
Label C
1.300
Label A
937
Label B
681
Label D
450
Label F
178
Label G
148
Label E
131
Label A+++
131
Label A++++
93
Label A+
86
Label A++
29
Label A+++++
2
| Year | Gas (m3) | Electricity (kWh) |
|---|---|---|
| 2020 | 1.330 | 3.180 |
| 2021 | 1.520 | 3.250 |
| 2022 | 1.180 | 3.040 |
| 2023 | 980 | 2.890 |
| 2024 | 950 | 2.960 |
Hoekwoning
Gas: 1.000 • Electricity: 2.790
Huurwoning
Gas: 770 • Electricity: 1.950
Koopwoning
Gas: 1.040 • Electricity: 3.180
Appartement
Gas: 590 • Electricity: 1.700
Tussenwoning
Gas: 860 • Electricity: 2.540
Vrijstaande woning
Gas: 1.450 • Electricity: 4.460
Twee-onder-één-kap woning
Gas: 1.080 • Electricity: 3.320
Total number of company establishments: 1.510
| Period | Crimes |
|---|---|
| jan 2026 | 17 |
| jul 2025 | 19 |
| jun 2025 | 17 |
| mei 2025 | 13 |
| mrt 2025 | 7 |
| mrt 2026 | 25 |
| nov 2024 | 12 |
| nov 2025 | 9 |
| okt 2024 | 11 |
| okt 2025 | 12 |
| sep 2024 | 17 |
| sep 2025 | 20 |
These figures give an indicative picture of safety trends in the living environment of Hoevelaken.
Short answers based on current local statistics, handy for a quick comparison of the living environment.
Hoevelaken telt in 2025 ongeveer 9.800 inwoners.
De gemiddelde WOZ-waarde in Hoevelaken is in 2025 circa € 523.000.
Het gemiddelde inkomen per inwoner in Hoevelaken ligt rond € 37.000 per jaar.
Voor het huidige jaar gaat het om ongeveer 161 geregistreerde misdrijven. Gebruik deze cijfers als indicatie en vergelijk trends per periode.
In Hoevelaken komt vooral "Tussenwoningen" veel voor, met ongeveer 1.575 woningen.