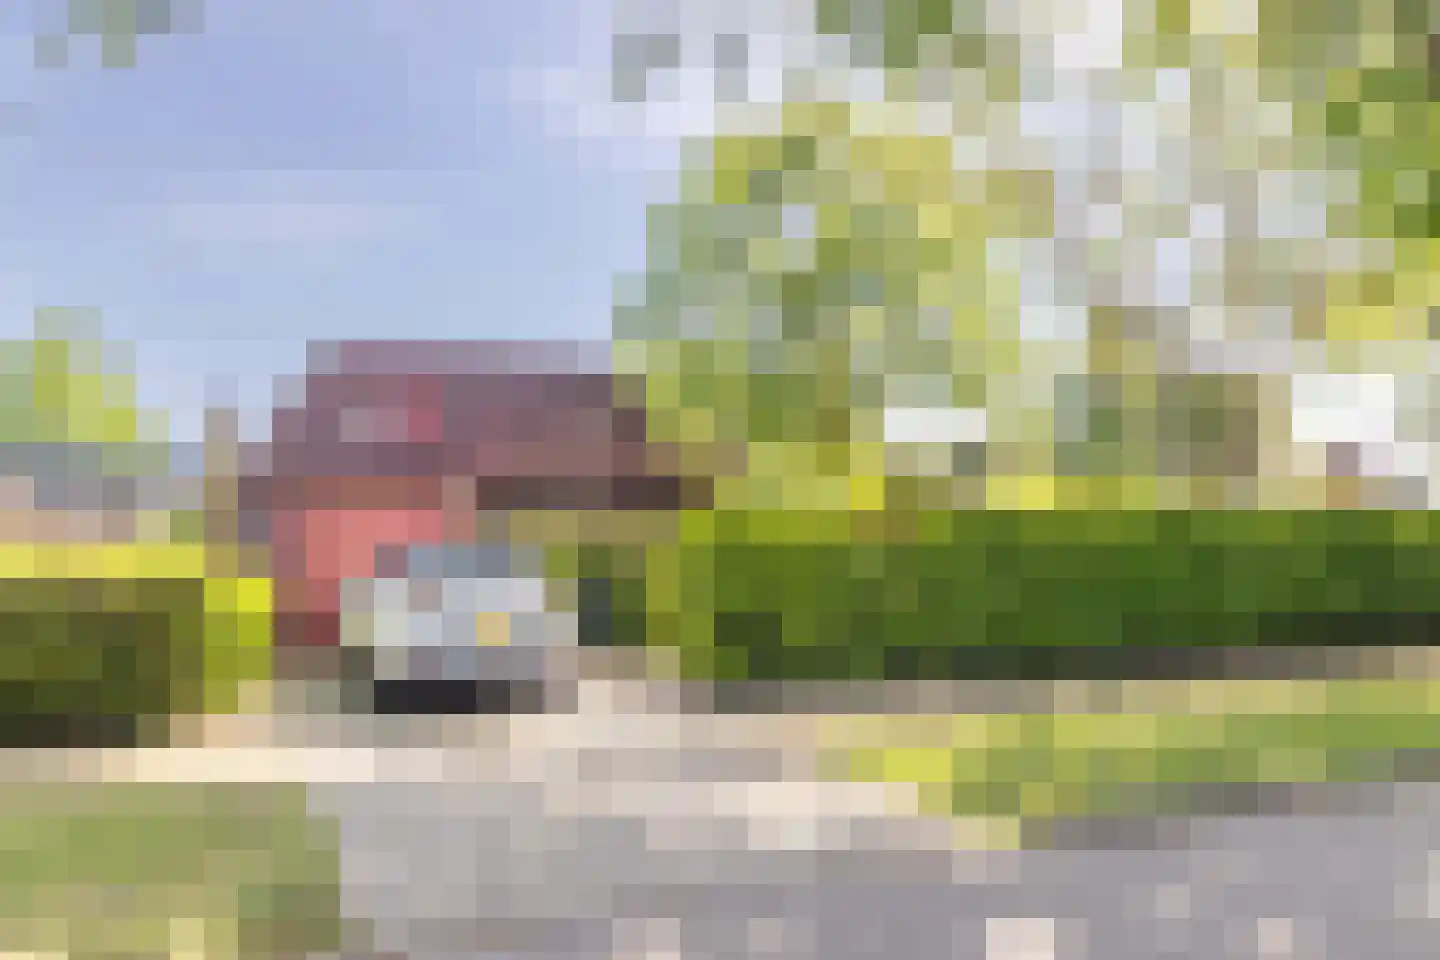
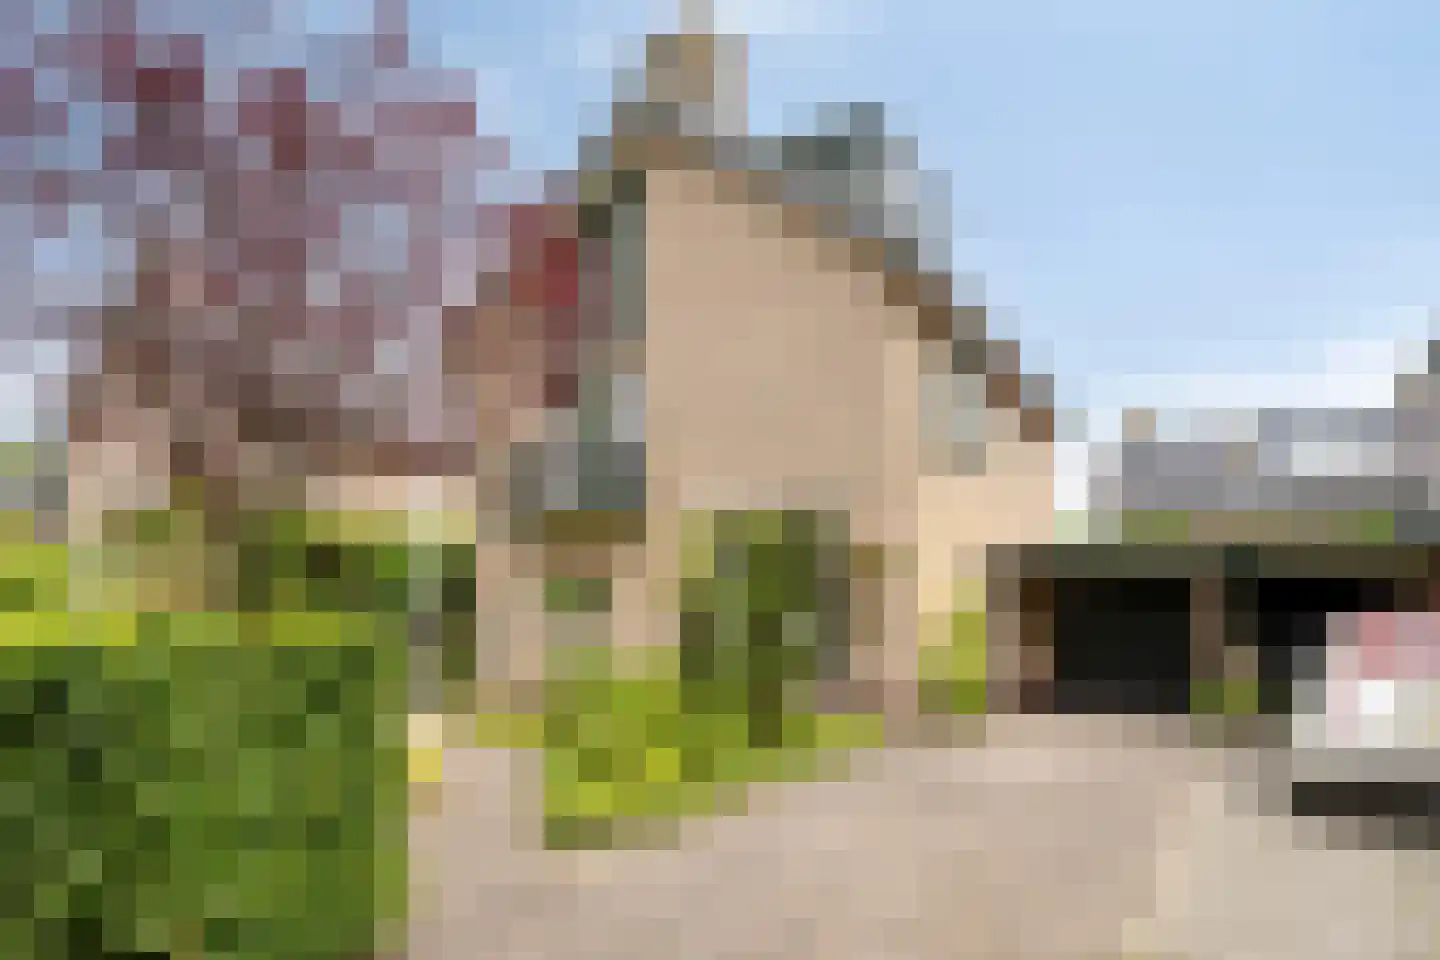
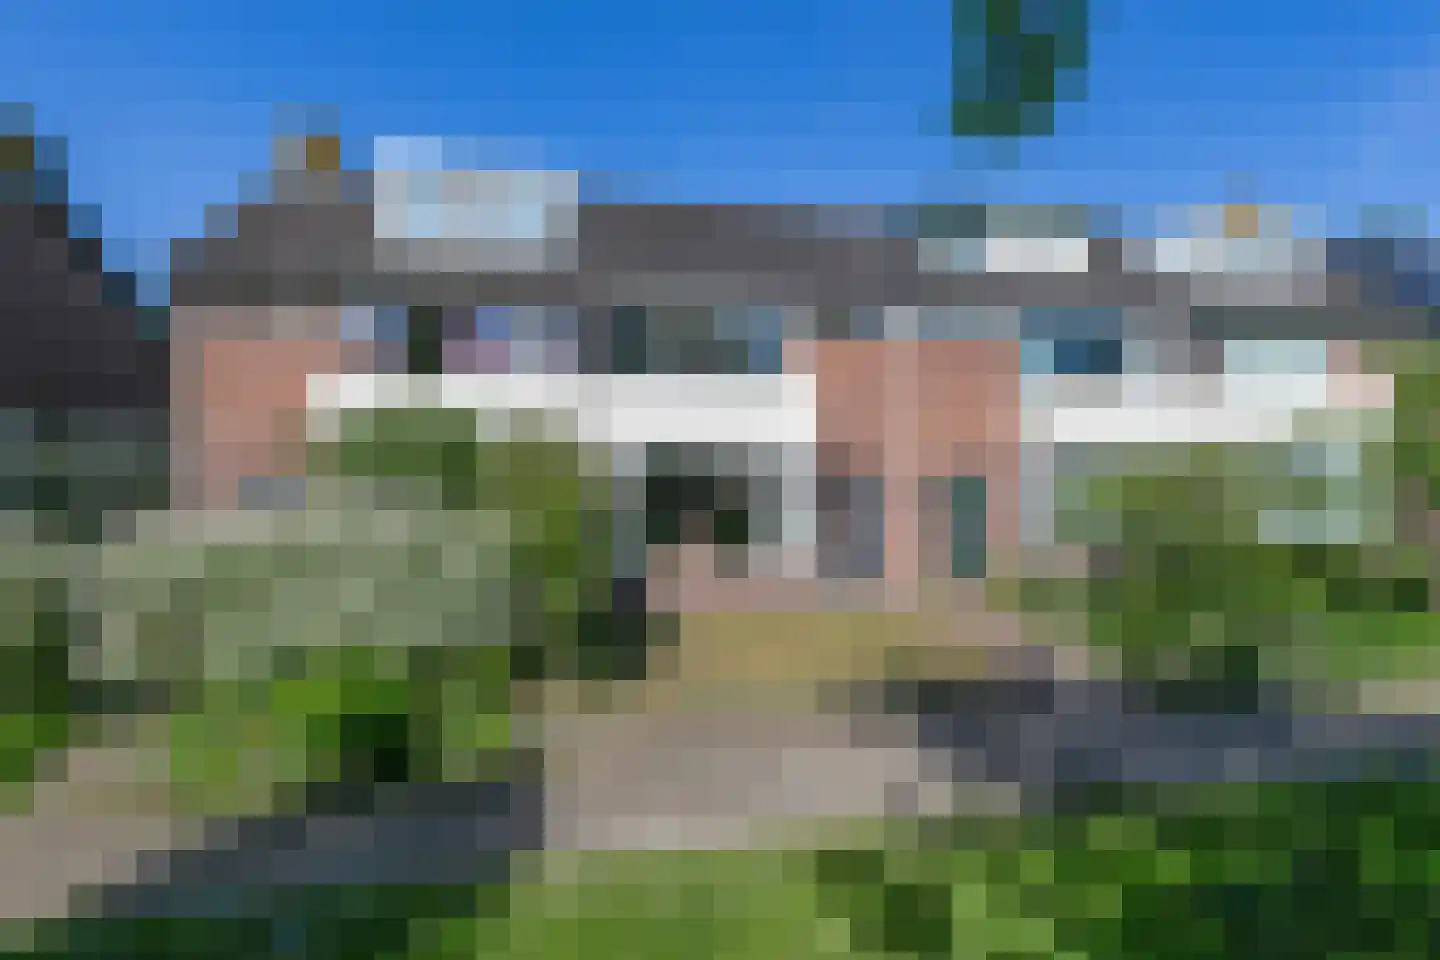
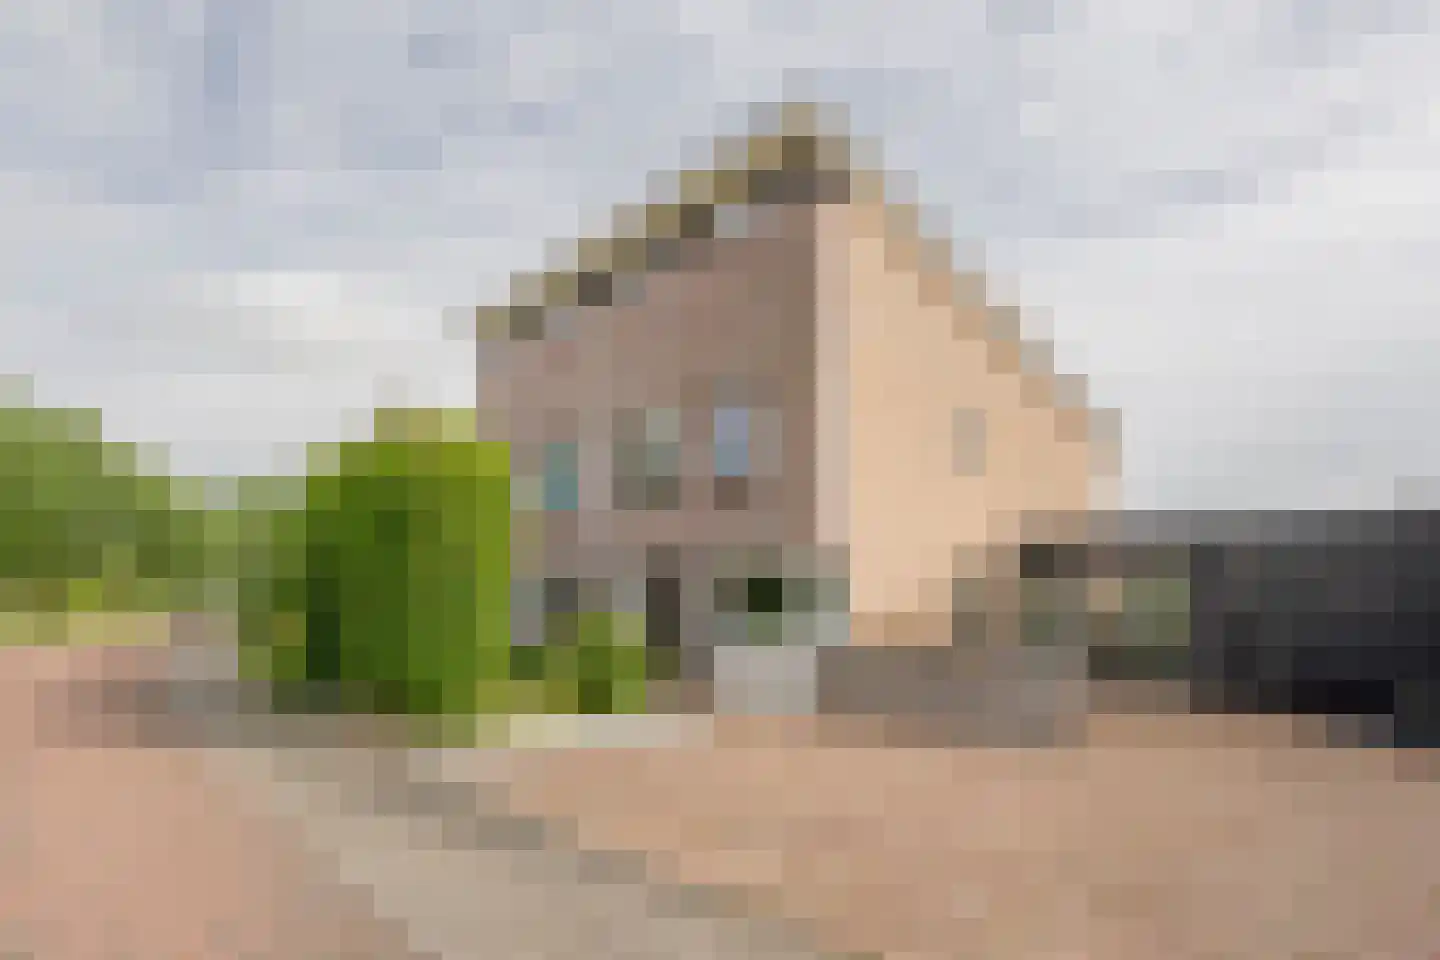
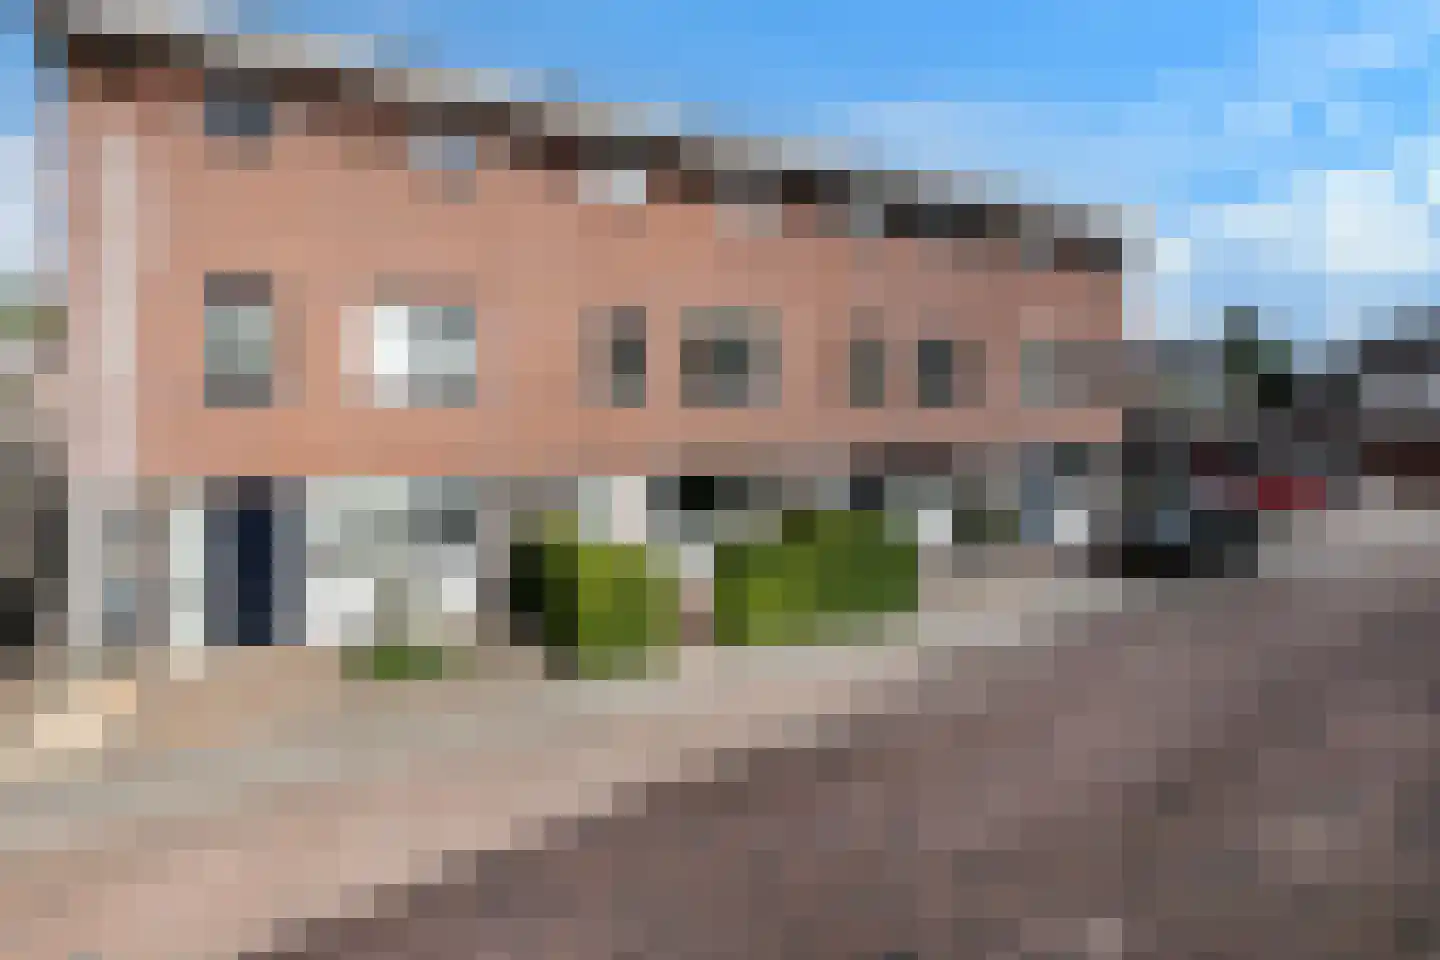
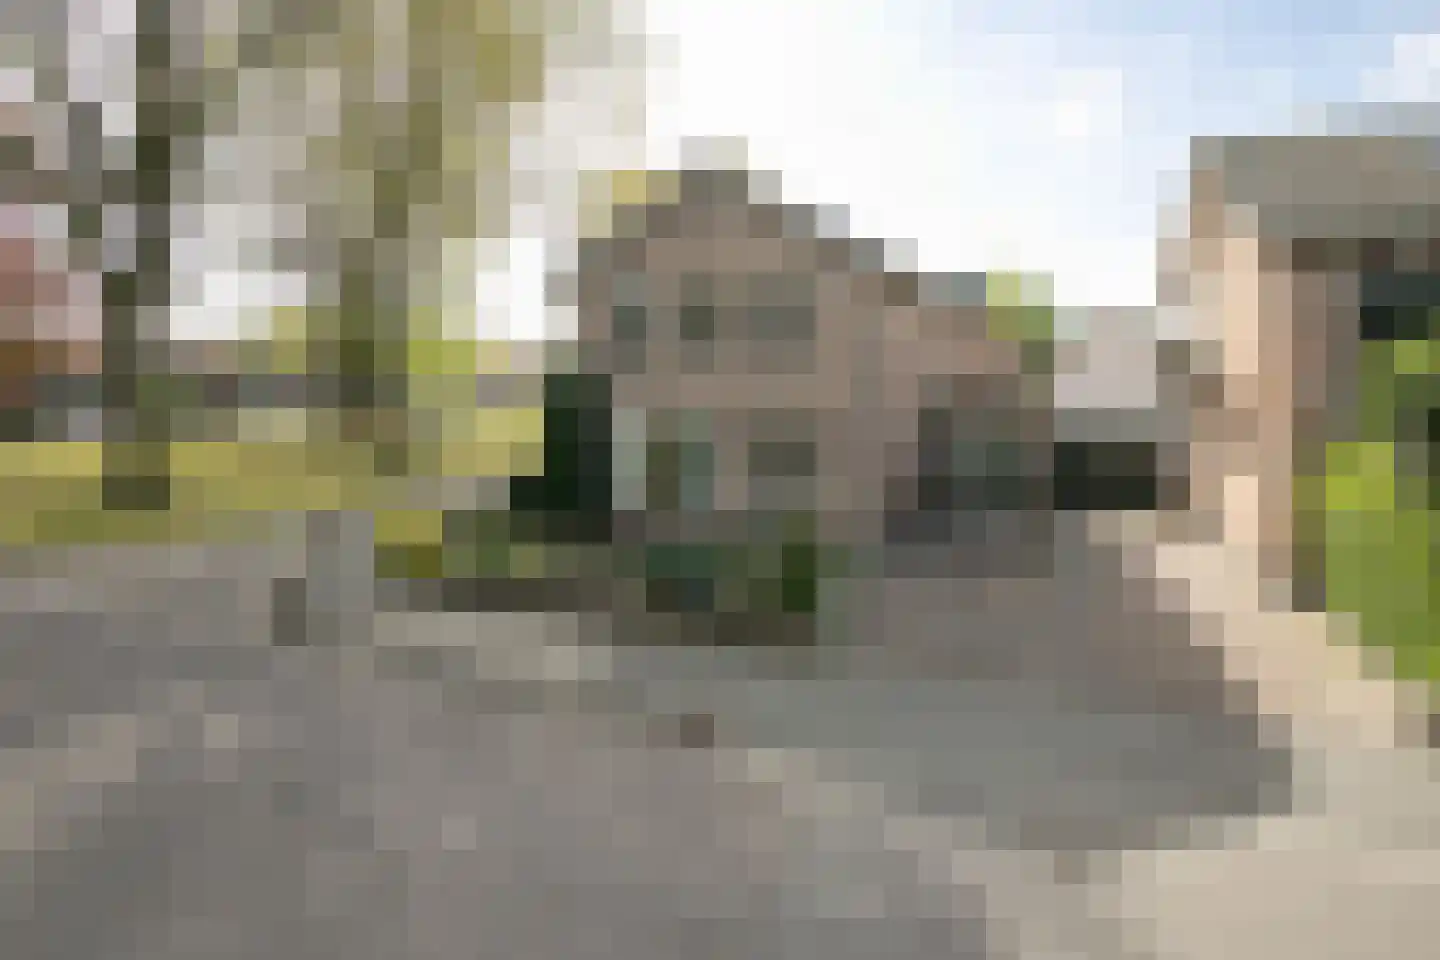
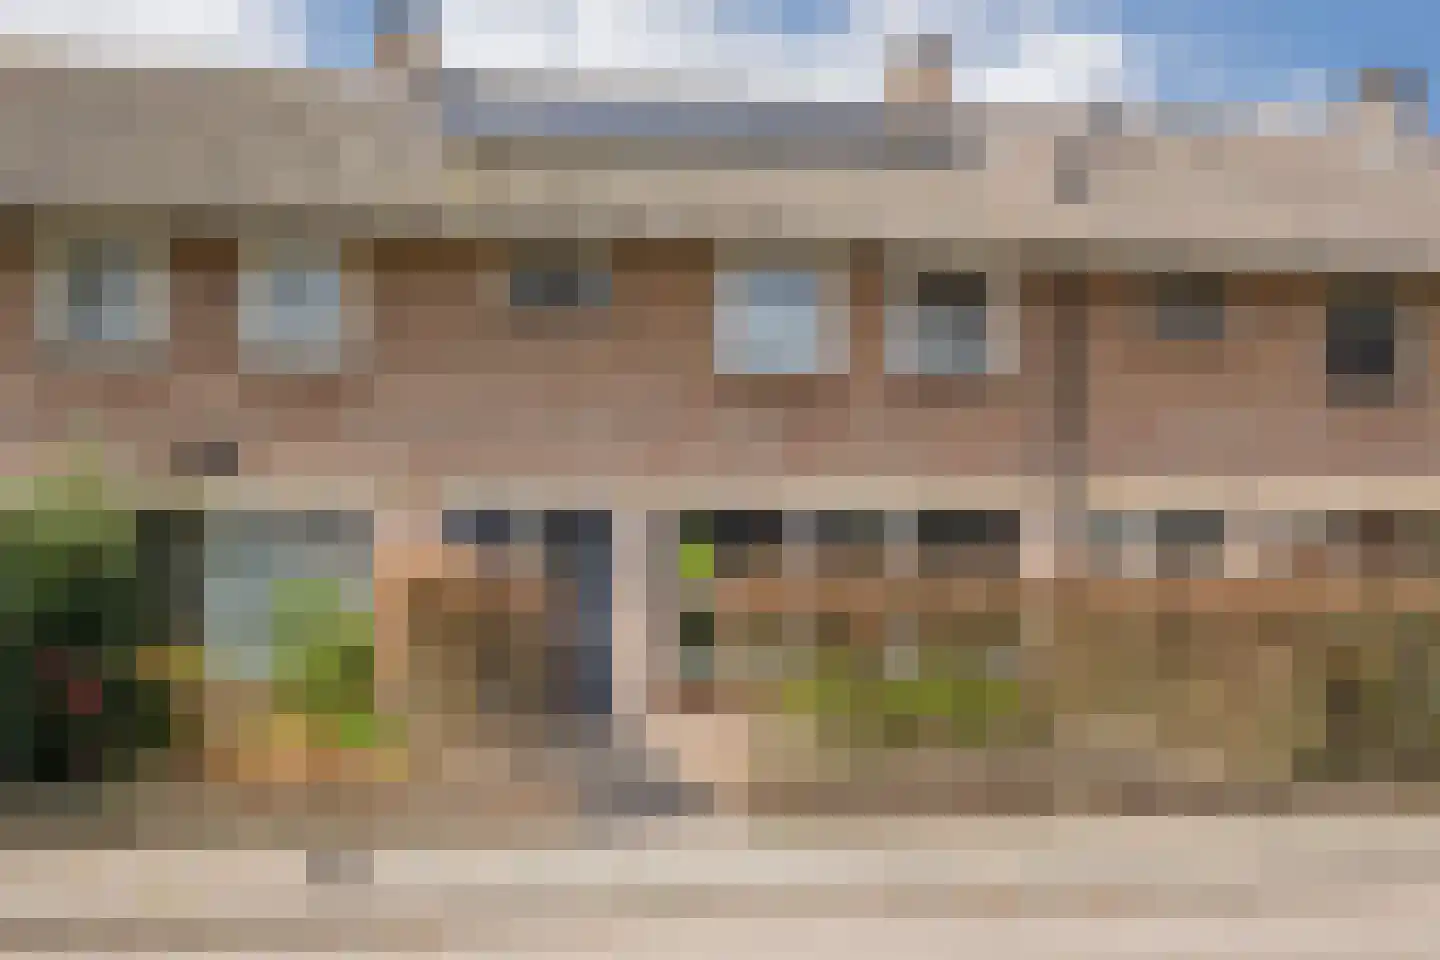
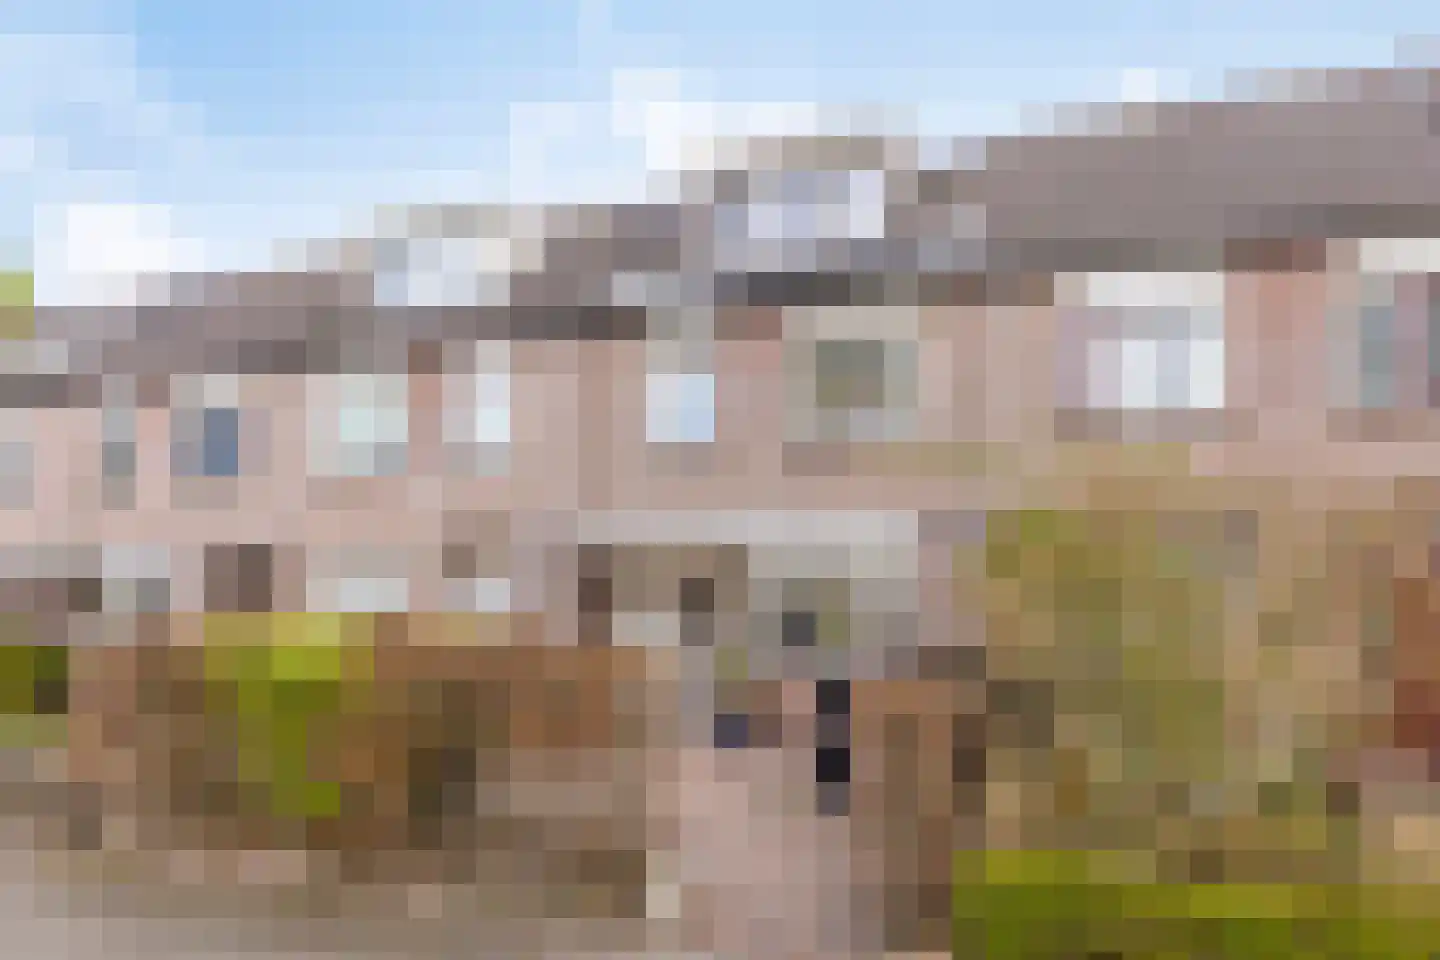
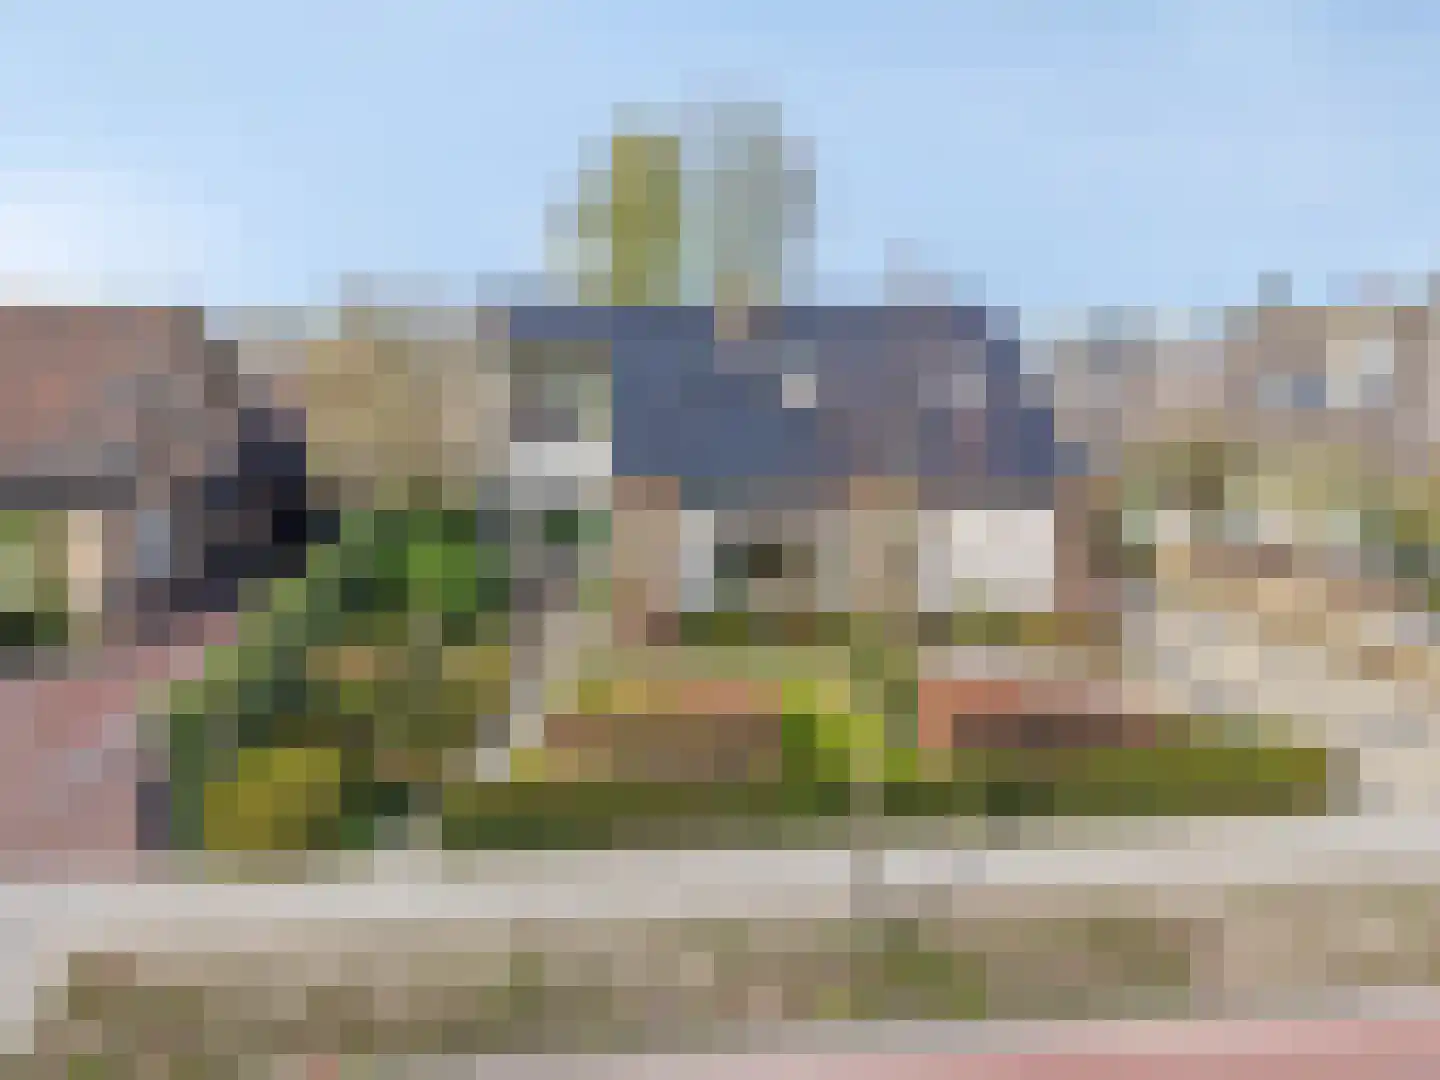
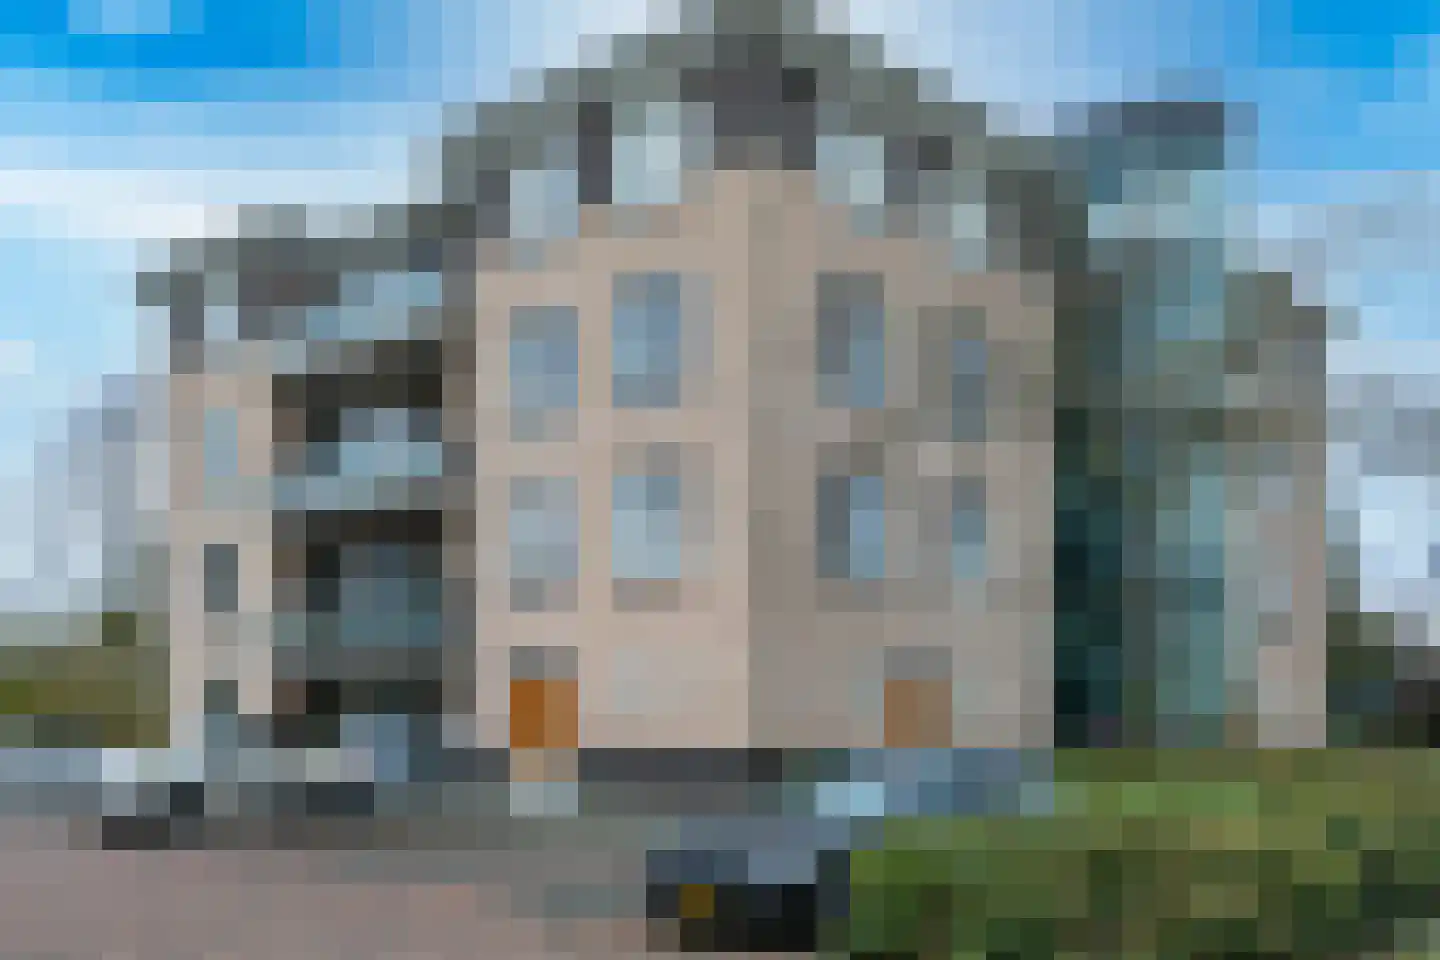
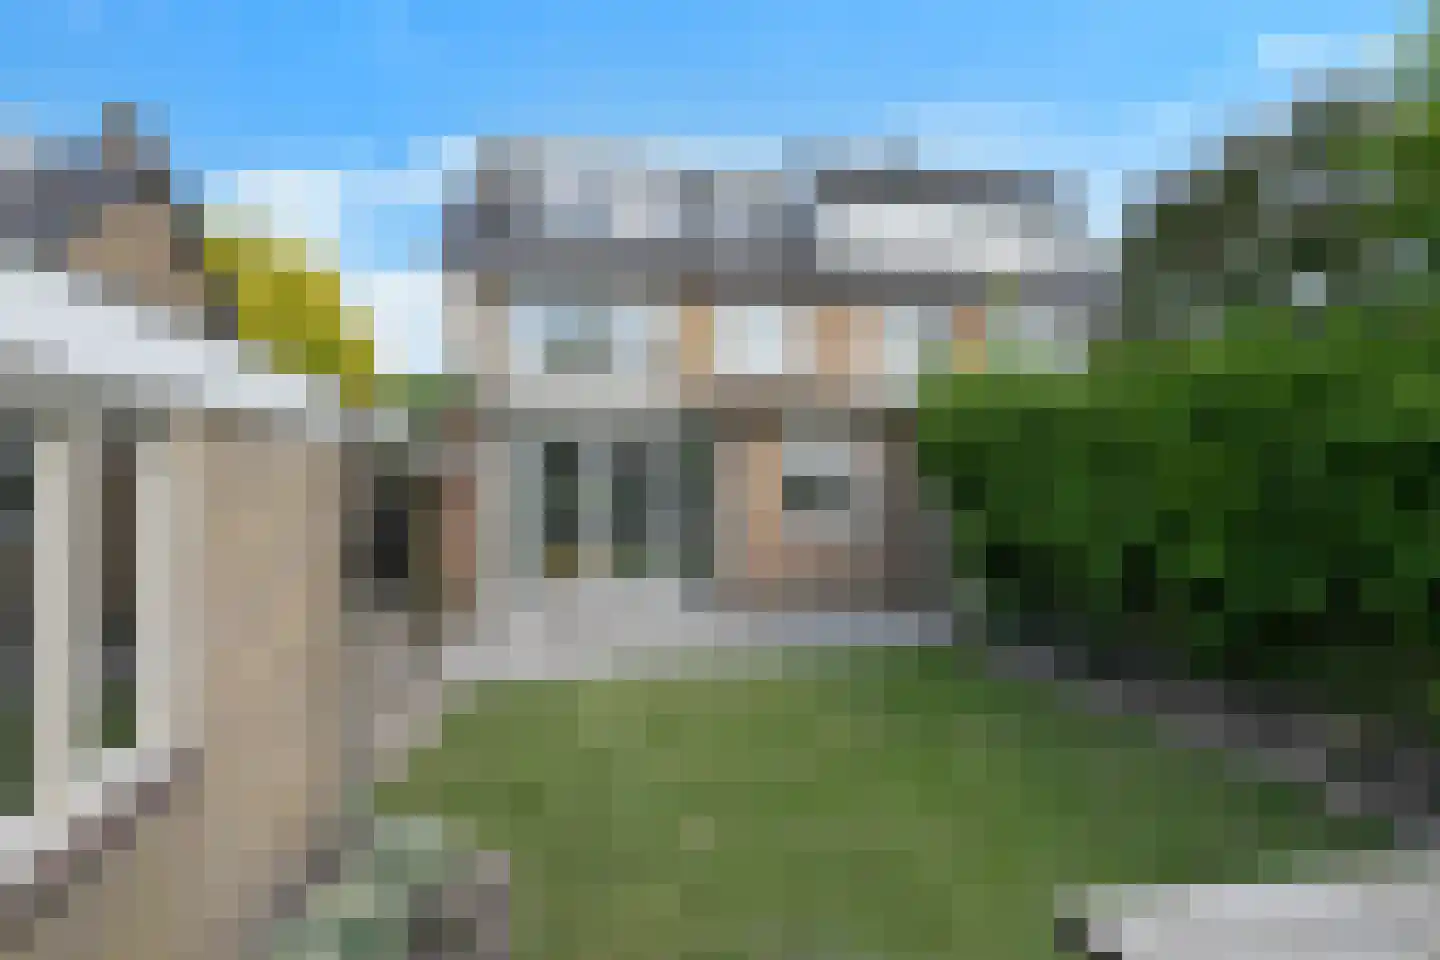
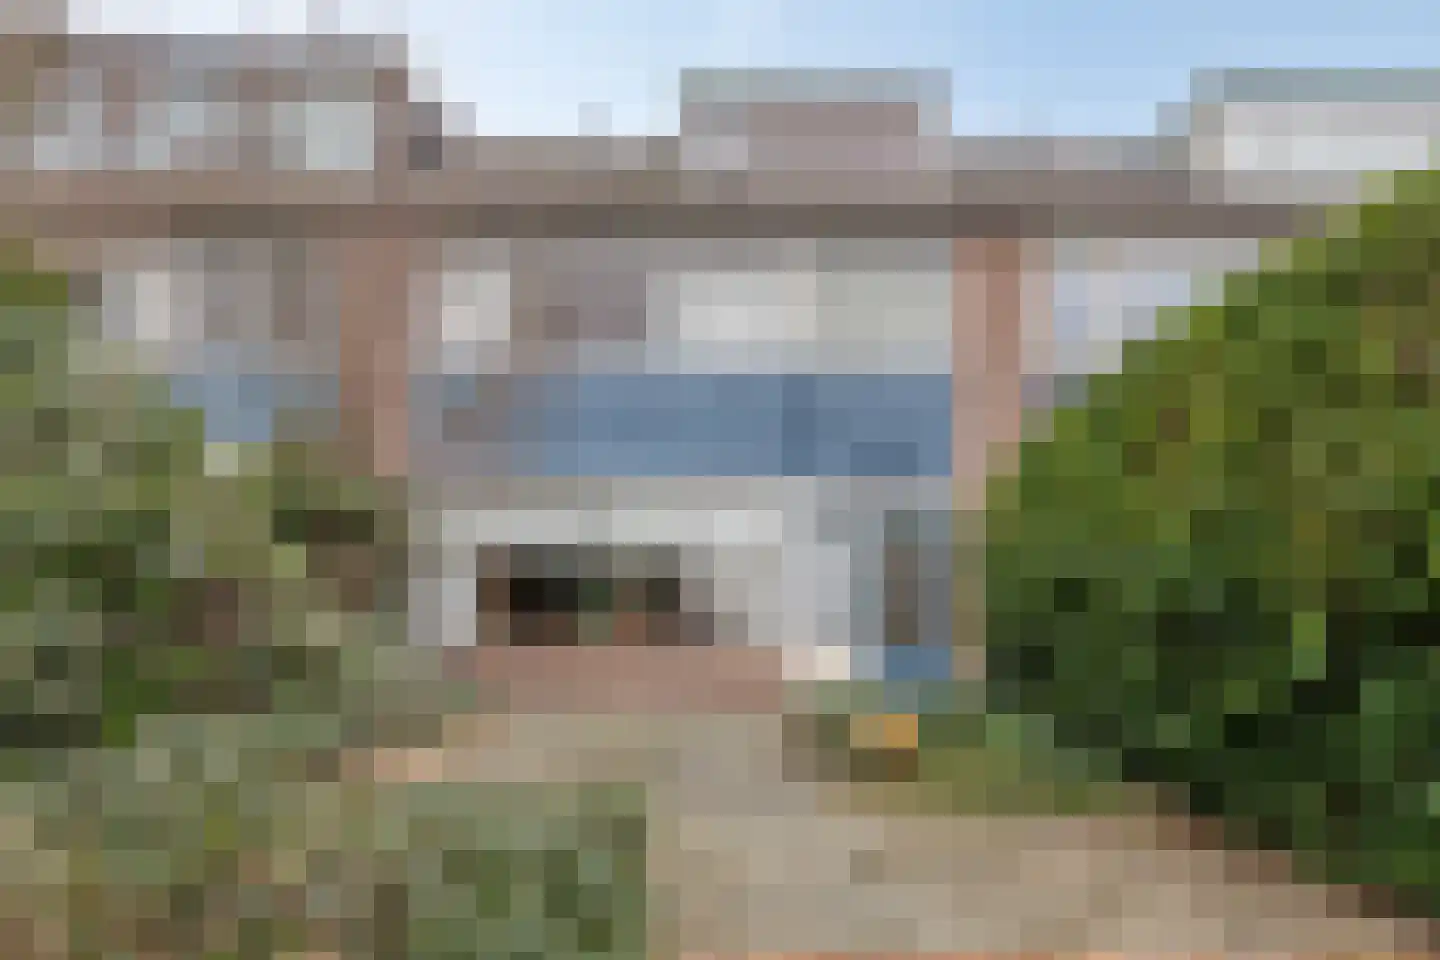
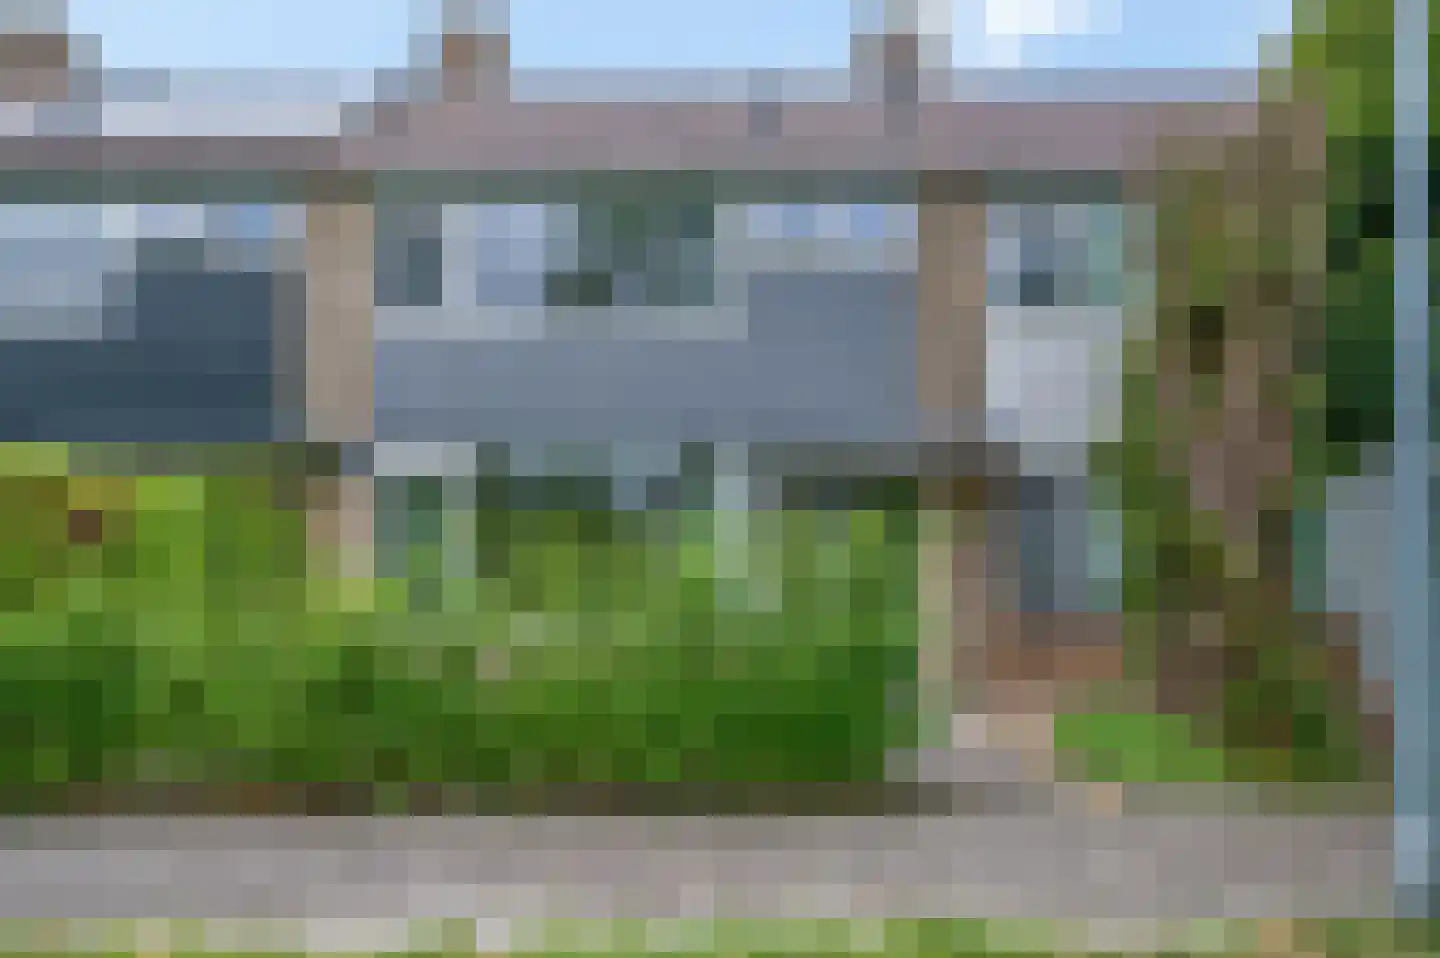
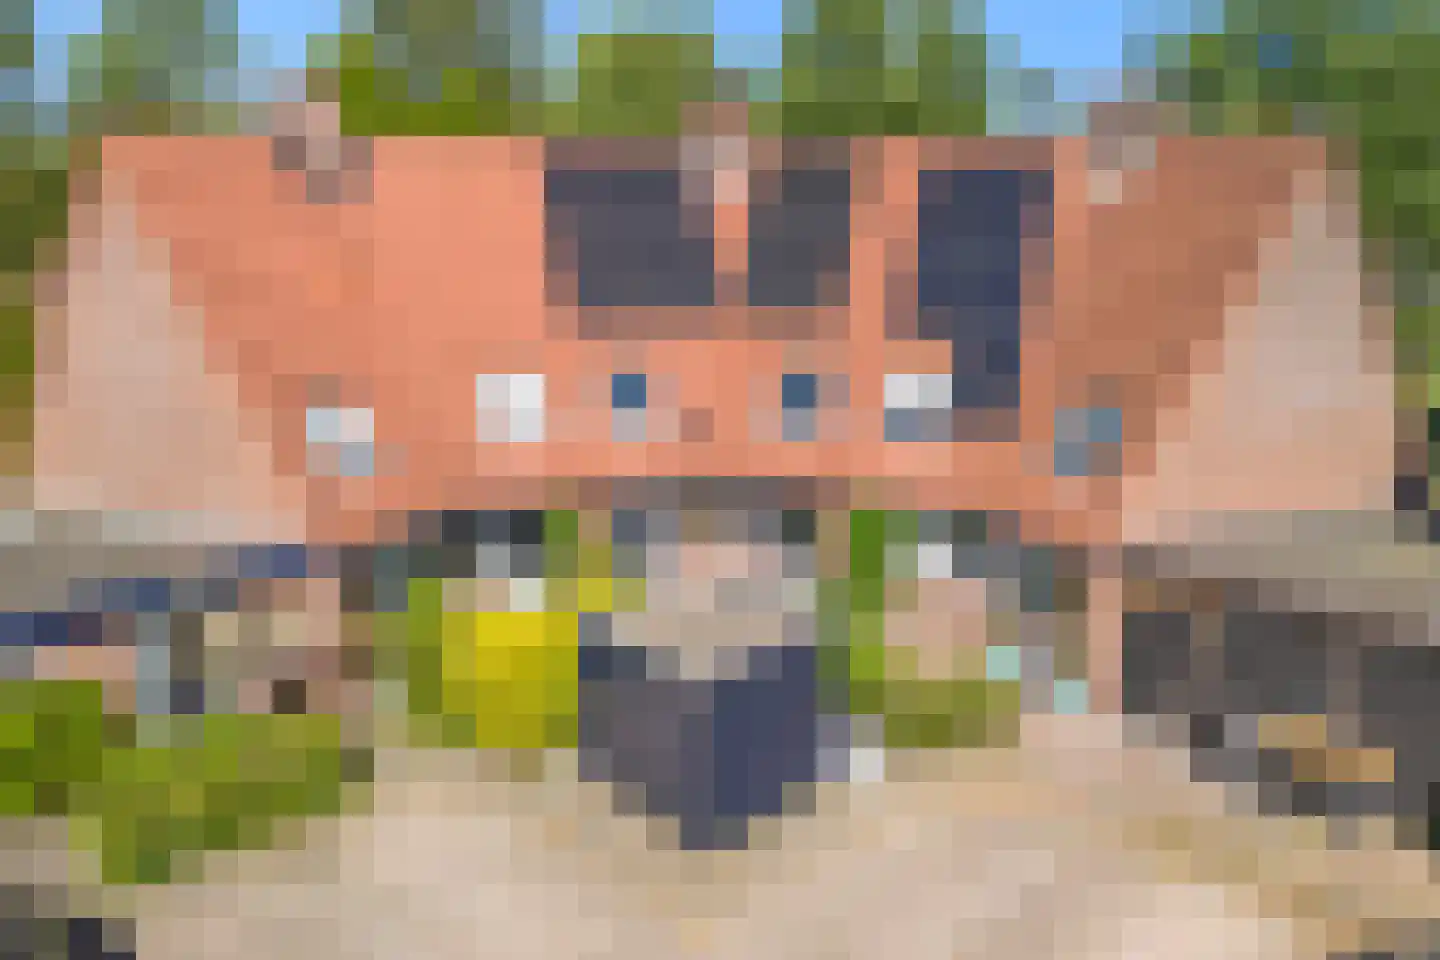
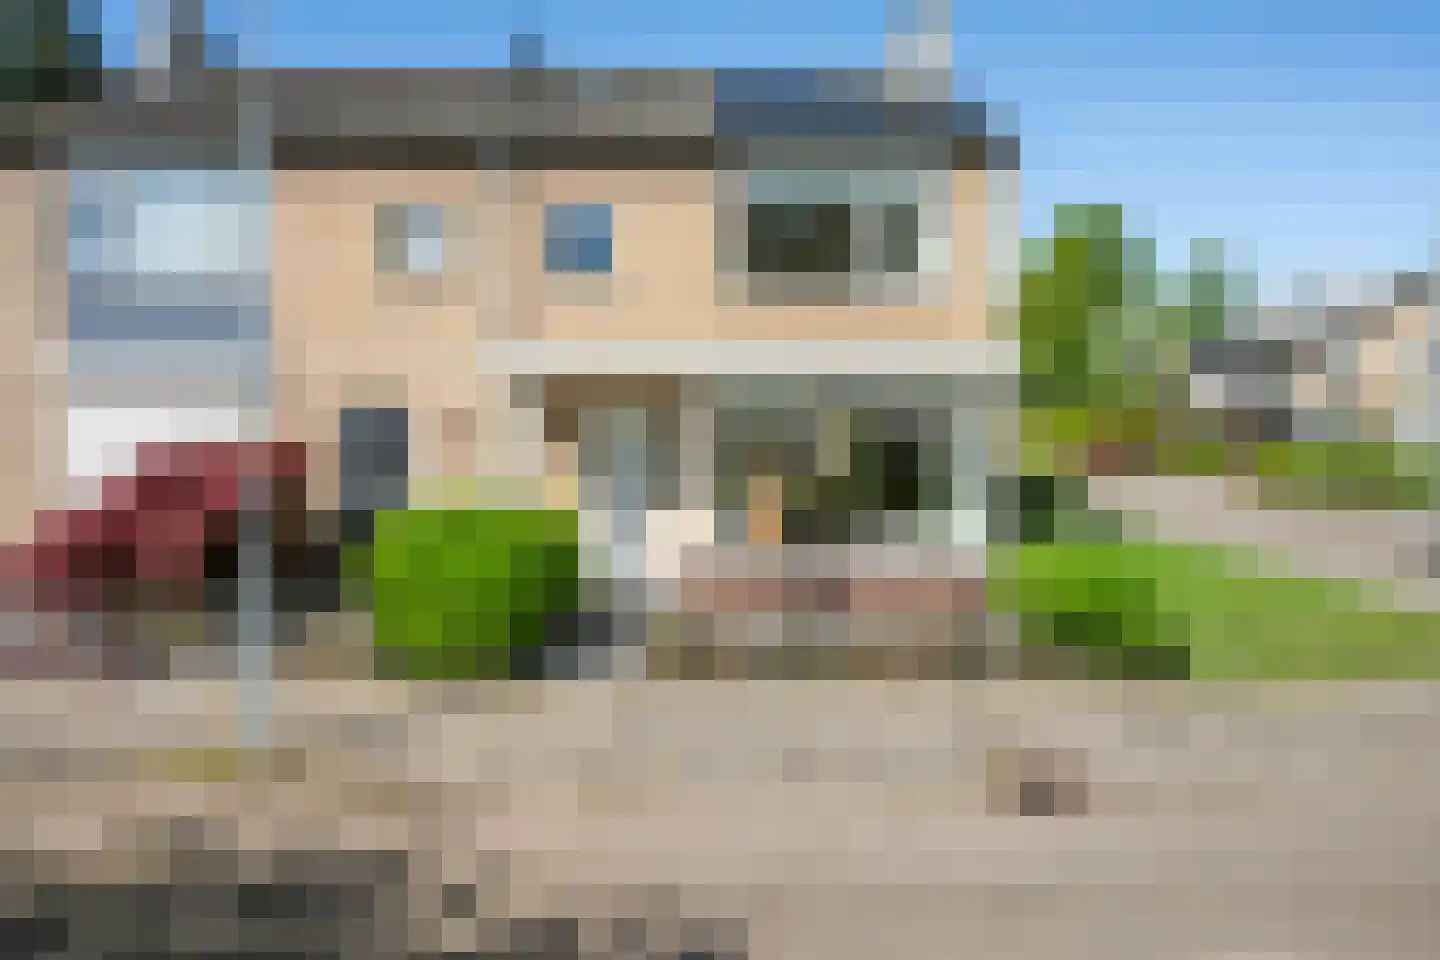
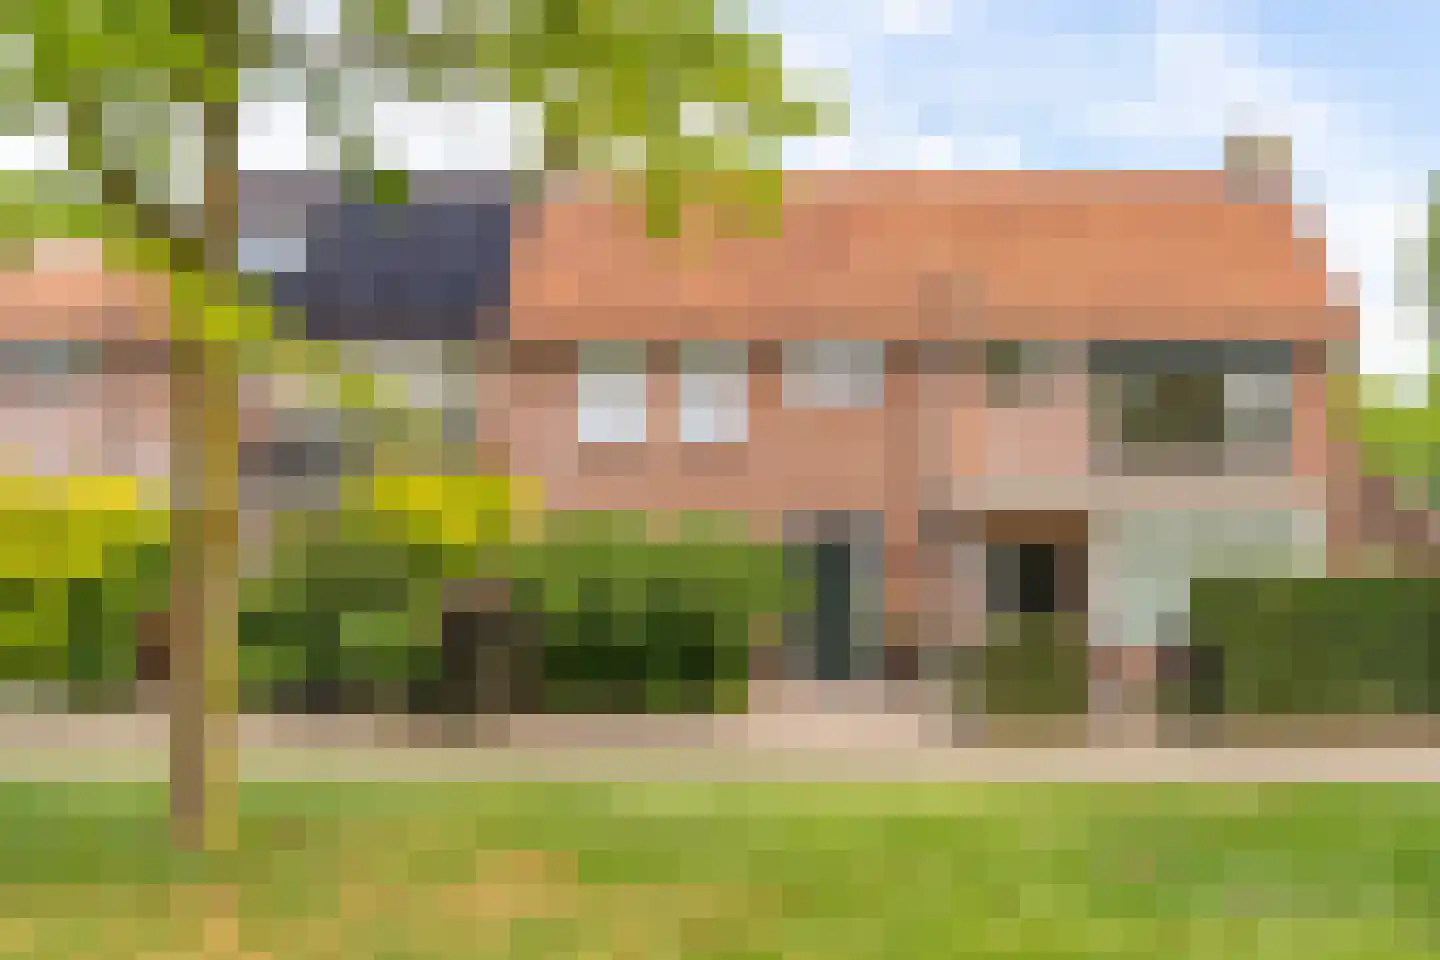
- Available
Klaprooslaan 21
3871GE Hoevelaken
€ 500.000 k.k.
€ 4.587/m²
- Living area
- 109 m²
- Land area
- 157 m²
- Bedrooms
- 3
Searching in 119 houses in Hoevelaken
Type to search. Use arrow down and arrow up to navigate through results and press Enter to open.
Hidden search suggestions.
View current properties in Hoevelaken or search targeted on street, postal code and property characteristics.
View the current housing stock in Hoevelaken and quickly filter by price, living area, rooms and more. There are currently 119 houses in this place within our selection. View also 89 sold houses in Hoevelaken for extra insight into the local housing market.
3871GE Hoevelaken
€ 500.000 k.k.
€ 4.587/m²
3871TA Hoevelaken
€ 849.000 k.k.
€ 4.516/m²
3871TJ Hoevelaken
€ 795.000 k.k.
€ 4.969/m²
3871JV Hoevelaken
€ 625.000 k.k.
€ 4.464/m²
3871JV Hoevelaken
€ 529.500 k.k.
€ 4.011/m²
3871HB Hoevelaken
€ 659.000 k.k.
€ 5.585/m²
3871XJ Hoevelaken
€ 645.000 k.k.
€ 4.479/m²
3871AT Hoevelaken
€ 399.000 k.k.
€ 5.115/m²
3871XH Hoevelaken
€ 515.000 k.k.
€ 4.440/m²
3871EN Hoevelaken
€ 495.000 k.k.
€ 4.125/m²
3871VK Hoevelaken
€ 535.000 k.k.
3871HB Hoevelaken
€ 600.000 k.k.
3871SE Hoevelaken
€ 1.050.000 k.k.
3871XE Hoevelaken
€ 418.500 k.k.
3871ML Hoevelaken
€ 575.000 k.k.
3871KP Hoevelaken
€ 535.000 k.k.
€ 4.280/m²
3871EH Hoevelaken
€ 625.000 k.k.
€ 5.734/m²
3871ED Hoevelaken
€ 525.000 k.k.
€ 4.907/m²
3871RD Hoevelaken
€ 500.000 k.k.
€ 4.464/m²
3871KR Hoevelaken
€ 1.095.000 k.k.
€ 2.765/m²
3871AC Hoevelaken
€ 1.159.000 k.k.
€ 5.083/m²
3871XK Hoevelaken
€ 425.000 k.k.
€ 6.439/m²
3871KM Hoevelaken
€ 998.000 k.k.
€ 4.578/m²
3871HJ Hoevelaken
€ 695.000 k.k.
€ 5.560/m²
3871CX Hoevelaken
€ 429.500 k.k.
€ 3.436/m²
3871CK Hoevelaken
€ 489.000 k.k.
€ 3.881/m²
3871ND Hoevelaken
€ 465.000 k.k.
€ 4.650/m²
3871EV Hoevelaken
€ 585.000 k.k.
Get free quotes from real estate agents with local market knowledge. Compare more than 85 real estate agents in Hoevelaken.
Selling a home in Hoevelaken? View the sales-oriented guide sell a house in Hoevelaken, compare all real estate agents in Hoevelaken or view the top 10 real estate agents in Hoevelaken for extra context to your choice.
Real estate agents make sharper offers when they know you're comparing — ask for quotes for sale or purchase.
Practical answers about housing supply, sales and comparing real estate agents in Hoevelaken.
The costs of a real estate agent in Hoevelaken depend on commission, setup costs, property presentation and the chosen service. Compare the 85 real estate agents in Hoevelaken via the real estate agent page and request multiple quotes to compare rates and approach well.
Within our selection, we are currently showing 119 houses in Hoevelaken. View also the sold houses in Hoevelaken to compare the current offering with recent transactions.
Take into account not only price and living area but also maintenance, energy label, location, outdoor space and sales status. This way you compare houses in Hoevelaken on more than just the asking price.
A local real estate agent knows the neighborhoods, recent transactions and demand in Hoevelaken. By comparing 85 real estate agents in the region you get a better insight into prices, sales strategy and expected yield; the top 10 in Hoevelaken provides a useful starting point.
Yes, when making a sales plan, a valuation in Hoevelaken is wise. You gain insight into a realistic asking price and can then compare offers from real estate agents specifically.
View current location data on residents, WOZ development, housing stock, energy consumption, business activity and safety in Hoevelaken. In 2025 were there 9.800 residents. The average WOZ value in 2025 is EUR 523.000.
These figures help to better assess and compare the housing stock in Hoevelaken with recent sold homes. Orient yourself then on suitable top real estate agents in Hoevelaken for sales advice in this region.
Residents
9.800
Last year: 2025
Average WOZ
EUR 523.000
Last year: 2025
Average income per person.
EUR 37.000
Source: AllNumbers
Crimes (current year)
161
Total registered
| Year | Residents |
|---|---|
| 2021 | 9.575 |
| 2022 | 9.745 |
| 2023 | 9.820 |
| 2024 | 9.800 |
| 2025 | 9.800 |
| Year | Average WOZ |
|---|---|
| 2021 | EUR 383.000 |
| 2022 | EUR 418.000 |
| 2023 | EUR 475.000 |
| 2024 | EUR 505.000 |
| 2025 | EUR 523.000 |
Hoger
2.580
Praktisch
1.590
Middelbaar
2.810
Europa
375
Nederland
8.585
Buiten Europa
835
Label C
1.300
Label A
937
Label B
681
Label D
450
Label F
178
Label G
148
Label E
131
Label A+++
131
Label A++++
93
Label A+
86
Label A++
29
Label A+++++
2
| Year | Gas (m3) | Electricity (kWh) |
|---|---|---|
| 2020 | 1.330 | 3.180 |
| 2021 | 1.520 | 3.250 |
| 2022 | 1.180 | 3.040 |
| 2023 | 980 | 2.890 |
| 2024 | 950 | 2.960 |
Hoekwoning
Gas: 1.000 • Electricity: 2.790
Huurwoning
Gas: 770 • Electricity: 1.950
Koopwoning
Gas: 1.040 • Electricity: 3.180
Appartement
Gas: 590 • Electricity: 1.700
Tussenwoning
Gas: 860 • Electricity: 2.540
Vrijstaande woning
Gas: 1.450 • Electricity: 4.460
Twee-onder-één-kap woning
Gas: 1.080 • Electricity: 3.320
Total number of company establishments: 1.510
| Period | Crimes |
|---|---|
| jan 2026 | 17 |
| jul 2025 | 19 |
| jun 2025 | 17 |
| mei 2025 | 13 |
| mrt 2025 | 7 |
| mrt 2026 | 25 |
| nov 2024 | 12 |
| nov 2025 | 9 |
| okt 2024 | 11 |
| okt 2025 | 12 |
| sep 2024 | 17 |
| sep 2025 | 20 |
These figures give an indicative picture of safety trends in the living environment of Hoevelaken.
Short answers based on current local statistics, handy for a quick comparison of the living environment.
Hoevelaken telt in 2025 ongeveer 9.800 inwoners.
De gemiddelde WOZ-waarde in Hoevelaken is in 2025 circa € 523.000.
Het gemiddelde inkomen per inwoner in Hoevelaken ligt rond € 37.000 per jaar.
Voor het huidige jaar gaat het om ongeveer 161 geregistreerde misdrijven. Gebruik deze cijfers als indicatie en vergelijk trends per periode.
In Hoevelaken komt vooral "Tussenwoningen" veel voor, met ongeveer 1.575 woningen.