
Residents
4.835
Last year: 2025
3829BW Hooglanderveen • Utrecht
€ 680.000
Cost of copper (estimated): € 15.450
2% transfer tax (€ 13.600) + notary (€ 1.150) + valuation (€ 700)
Total incl. VAT: € 695.450
Purchase price /m²: € 5.965
Eindwoning In het sfeervolle nieuwbouwproject Houtrust worden moderne en comfortabele eindwoningen gerealiseerd met een woonoppervlakte van circa 114 m². Deze woningen zijn ideaal voor gezinnen en bieden een praktische indeling gecombineerd met veel lichtinval. Aan de voorzijde van de woning bevindt zich de open keuken, waar je alle ruimte hebt om jouw droomkeuken te realiseren. Aan de achterzijde ligt de tuingerichte woonkamer, voorzien van grote raampartijen die zorgen voor een prettige lichtinval en een directe verbinding met de tuin. Op de eerste verdieping bevinden zich drie volwaardige slaapkamers en een ruime badkamer. De badkamer is compleet uitgerust met een douche, wastafel en toilet, en wordt opgeleverd inclusief sanitair en tegelwerk. Via een vaste trap bereik je de zolderverdieping. Deze open ruimte is voorzien van een standaard dakraam aan de voorzijde en biedt volop mogelijkheden, zoals een extra slaapkamer, werkruimte of hobbykamer. Schrijf je in via de projectwebsite: Schoonderbeekbouw.nl
€ 680.000
Cost of copper (estimated): € 15.450
2% transfer tax (€ 13.600) + notary (€ 1.150) + valuation (€ 700)
Total purchase (incl. p.p.): € 695.450
3,04%
Yearly
€ 34.000
Direct available
Estimated mortgage
Indicative gross monthly cost
Based on annuity and 30 year term
Indicative net monthly cost
iDisclaimer: this mortgage calculation is a simplified indication based on general assumptions. No rights can be derived from the results shown. Calculated with 10-annual interest (zonder NHG), automatically determined based on the price limit € 470.000. Source: 10-jaars rente uit mortgage_rates (04-05-2026 03:45). For non-NHG, an 80% mortgage of the market value has been used in this indication.
Douche, toilet, en wastafel
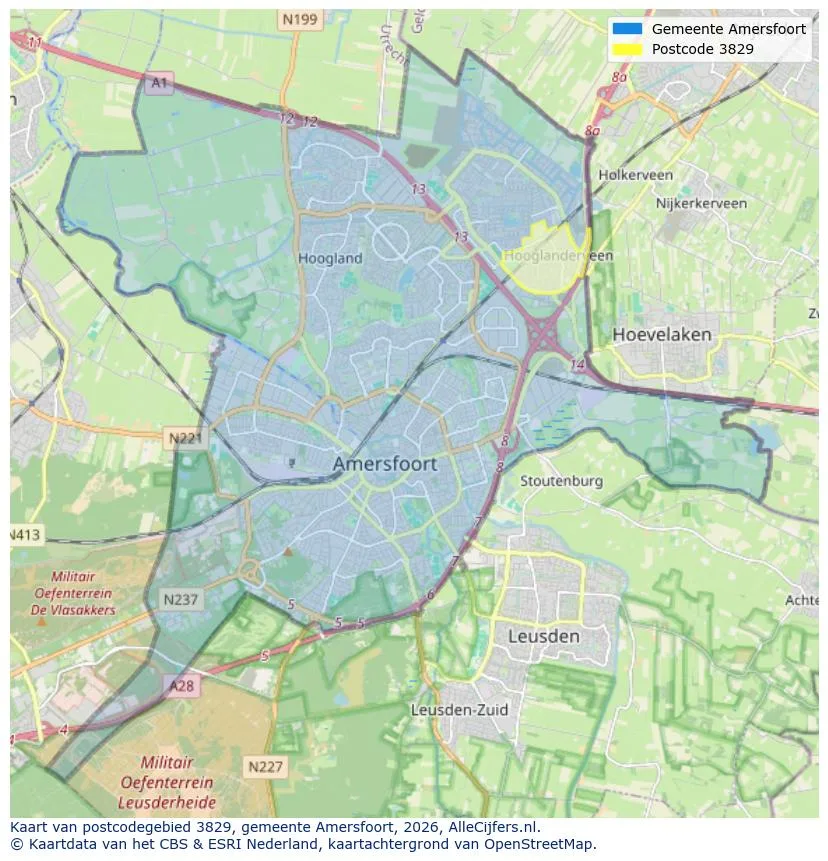
View the location and discover the brokers in this region
View current location data on residents, WOZ development, housing stock, energy consumption, business activity and safety in Hooglanderveen. In 2025 were there 4.835 residents. The average WOZ value in 2025 is EUR 585.000.
Residents
4.835
Last year: 2025
Average WOZ
EUR 585.000
Last year: 2025
Average income per person.
EUR 40.600
Source: AllNumbers
Crimes (current year)
83
Total registered
| Year | Residents |
|---|---|
| 2021 | 4.935 |
| 2022 | 4.910 |
| 2023 | 4.875 |
| 2024 | 4.870 |
| 2025 | 4.835 |
| Year | Average WOZ |
|---|---|
| 2021 | EUR 419.000 |
| 2022 | EUR 463.000 |
| 2023 | EUR 543.000 |
| 2024 | EUR 546.000 |
| 2025 | EUR 585.000 |
Hoger
1.590
Praktisch
580
Middelbaar
1.340
Europa
230
Nederland
3.910
Buiten Europa
695
Label A
1.067
Label C
253
Label B
233
Label D
67
Label E
54
Label F
44
Label A+
35
Label G
30
Label A+++
11
Label A++
6
Label A++++
0
Label A+++++
0
| Year | Gas (m3) | Electricity (kWh) |
|---|---|---|
| 2020 | 1.150 | 3.290 |
| 2021 | 1.300 | 3.430 |
| 2022 | 1.030 | 3.230 |
| 2023 | 880 | 3.040 |
| 2024 | 860 | 3.180 |
Hoekwoning
Gas: 920 • Electricity: 3.040
Huurwoning
Gas: 700 • Electricity: 1.910
Koopwoning
Gas: 940 • Electricity: 3.380
Appartement
Gas: 620 • Electricity: 1.690
Tussenwoning
Gas: 770 • Electricity: 2.650
Vrijstaande woning
Gas: 1.220 • Electricity: 4.690
Twee-onder-één-kap woning
Gas: 1.000 • Electricity: 3.640
Total number of company establishments: 585
| Period | Crimes |
|---|---|
| jan 2026 | 6 |
| jul 2025 | 8 |
| jun 2025 | 11 |
| mei 2025 | 8 |
| mrt 2025 | 12 |
| mrt 2026 | 4 |
| nov 2024 | 9 |
| nov 2025 | 3 |
| okt 2024 | 7 |
| okt 2025 | 6 |
| sep 2024 | 16 |
| sep 2025 | 6 |
These figures give an indicative picture of safety trends in the living environment of Hooglanderveen.
Short answers based on current local statistics, handy for a quick comparison of the living environment.
Hooglanderveen telt in 2025 ongeveer 4.835 inwoners.
De gemiddelde WOZ-waarde in Hooglanderveen is in 2025 circa € 585.000.
Het gemiddelde inkomen per inwoner in Hooglanderveen ligt rond € 40.600 per jaar.
Voor het huidige jaar gaat het om ongeveer 83 geregistreerde misdrijven. Gebruik deze cijfers als indicatie en vergelijk trends per periode.
In Hooglanderveen komt vooral "Tussenwoningen" veel voor, met ongeveer 622 woningen.
View more homes in this location.
3829AD Hooglanderveen
€ 869.000 k.k.

3829CD Hooglanderveen
€ 519.500 k.k.
€ 4.293/m²
3829AH Hooglanderveen
€ 1.585.000 k.k.
€ 5.681/m²
3829GD Hooglanderveen
€ 625.000 k.k.
€ 5.252/m²

3829BC Hooglanderveen
€ 685.000
€ 6.009/m²

3829BC Hooglanderveen
€ 655.000 k.k.
€ 5.746/m²

3829DB Hooglanderveen
€ 679.000 k.k.
€ 4.956/m²
3829EW Hooglanderveen
€ 550.000 k.k.
€ 4.583/m²
