
Inwoners
1.663
Laatste jaar: 2026
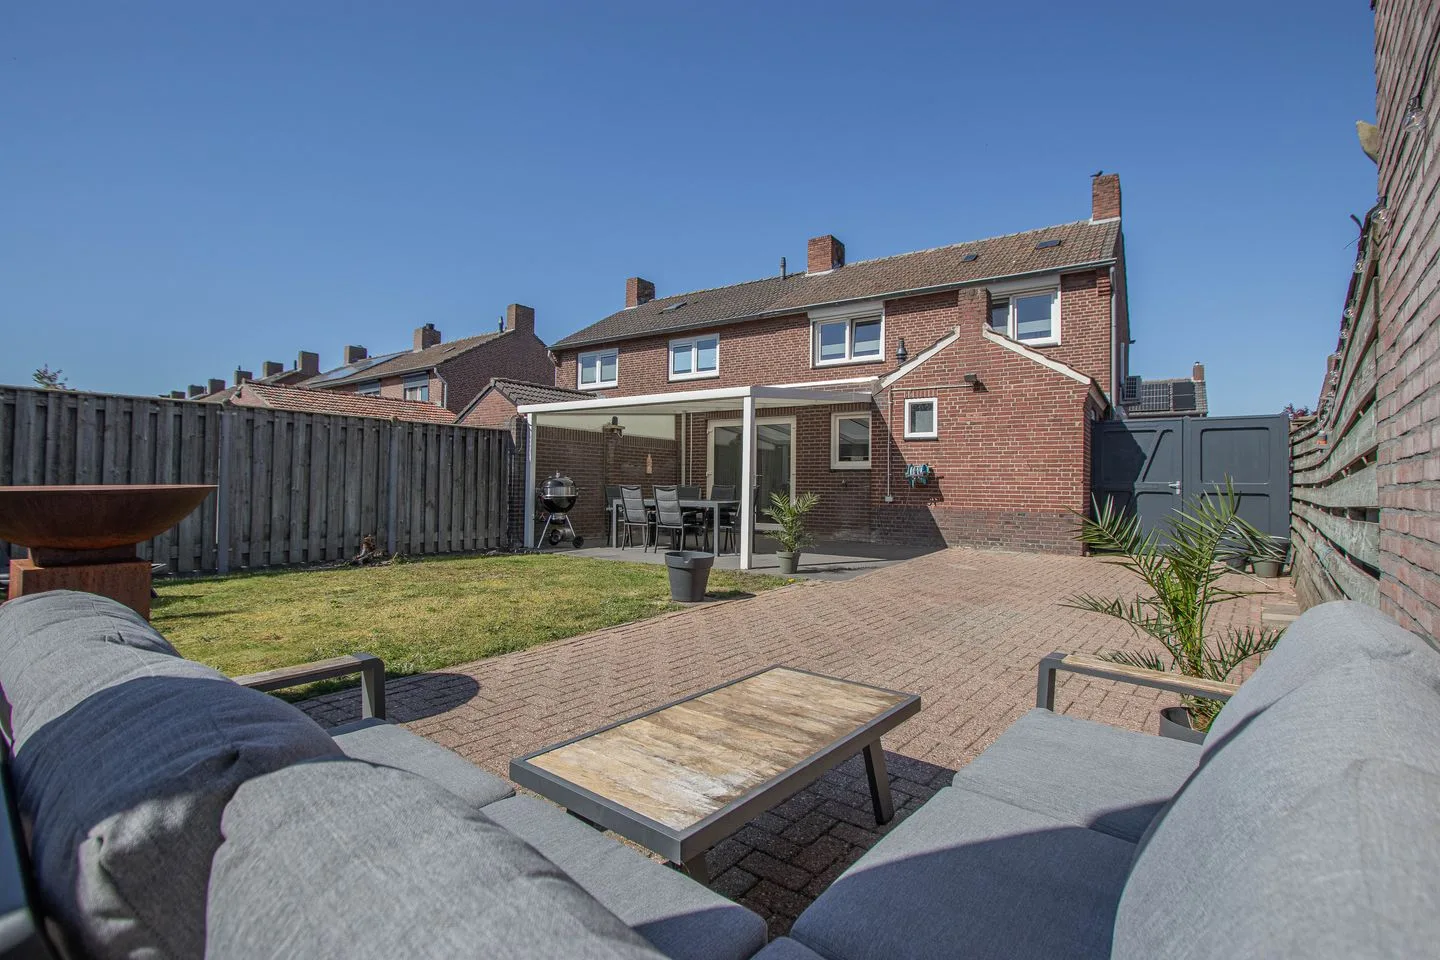
6014BT Ittervoort • Limburg
€ 575.000 k.k.
Kosten koper (geschat): € 13.350
2% overdrachtsbelasting (€ 11.500) + notaris (€ 1.150) + taxatie (€ 700)
Totaal incl. k.k.: € 588.350
€ 575.000
Kosten koper (geschat): € 13.350
2% overdrachtsbelasting (€ 11.500) + notaris (€ 1.150) + taxatie (€ 700)
Totaal aankoop (incl. k.k.): € 588.350
3,28%
Jaarlijks
€ 28.750
Direct beschikbaar
Geschatte hypotheek
Indicatieve bruto maandlast
Gebaseerd op annuïteit en 30 jaar looptijd
Indicatieve netto maandlast
iDisclaimer: deze hypotheekberekening is een versimpelde indicatie op basis van algemene aannames. Aan de getoonde uitkomsten kunnen geen rechten worden ontleend. Gerekend met 10-jaars rente (zonder NHG), automatisch bepaald op basis van vraagprijsgrens € 470.000. Bron: 10-jaars rente uit mortgage_rates (27-06-2026 03:45). Bij niet-NHG is in deze indicatie uitgegaan van een 80% hypotheek van de marktwaarde.
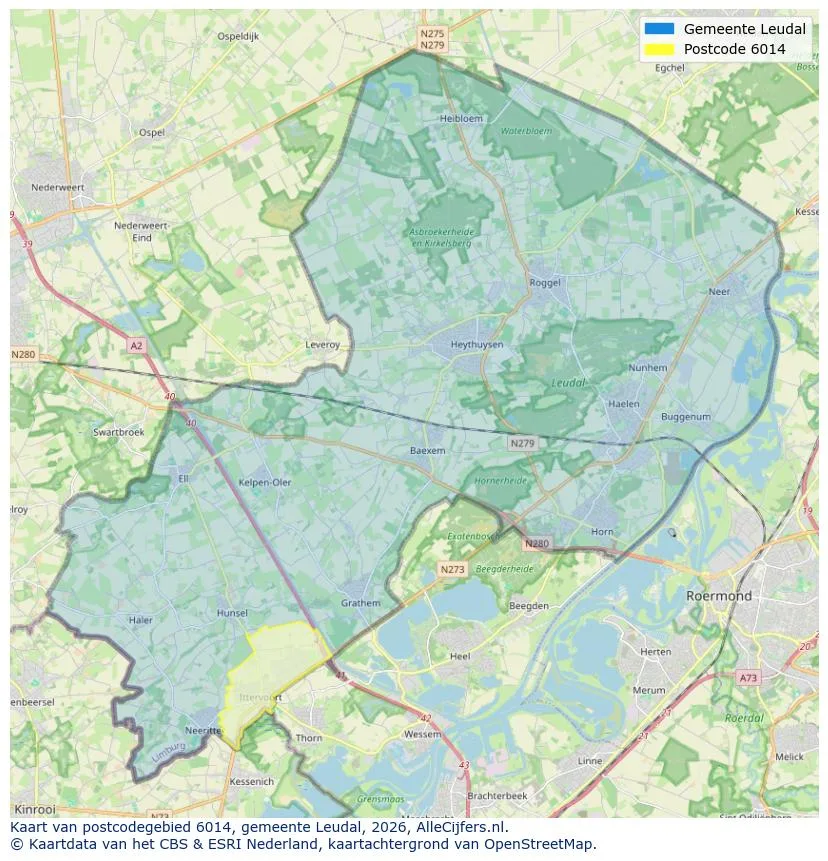
Ruimtelijk overzicht van het werkgebied in Ittervoort
Bekijk actuele plaatsdata over inwoners, WOZ-ontwikkeling, woningvoorraad, energieverbruik, bedrijvigheid en veiligheid in Ittervoort. In 2026 waren er 1.663 inwoners. De gemiddelde WOZ-waarde in 2025 is EUR 350.000.
Inwoners
1.663
Laatste jaar: 2026
Gemiddelde WOZ
EUR 350.000
Laatste jaar: 2025
Gemiddeld inkomen p.p.
EUR 32.000
Bron: AlleCijfers
Misdrijven (huidig jaar)
60
Totaal geregistreerd
| Jaar | Inwoners |
|---|---|
| 2021 | 1.650 |
| 2022 | 1.670 |
| 2023 | 1.675 |
| 2024 | 1.655 |
| 2025 | 1.650 |
| 2026 | 1.663 |
| Jaar | Gemiddelde WOZ |
|---|---|
| 2021 | EUR 249.000 |
| 2022 | EUR 265.000 |
| 2023 | EUR 321.000 |
| 2024 | EUR 325.000 |
| 2025 | EUR 350.000 |
Hoger
340
Praktisch
330
Middelbaar
600
Europa
190
Nederland
1.330
Buiten Europa
130
Label C
238
Label D
159
Label B
147
Label A
112
Label F
51
Label G
44
Label E
22
Label A+
10
Label A+++
6
Label A++
3
Label A++++
1
Label A+++++
0
| Jaar | Gas (m3) | Elektriciteit (kWh) |
|---|---|---|
| 2020 | 1.510 | 3.280 |
| 2021 | 1.730 | 3.310 |
| 2022 | 1.340 | 3.110 |
| 2023 | 1.110 | 2.990 |
| 2024 | 1.060 | 3.130 |
Hoekwoning
Gas: 980 • Elektriciteit: 2.790
Huurwoning
Gas: 910 • Elektriciteit: 2.130
Koopwoning
Gas: 1.140 • Elektriciteit: 3.160
Appartement
Gas: 890 • Elektriciteit: 1.920
Tussenwoning
Gas: 950 • Elektriciteit: 2.650
Vrijstaande woning
Gas: 1.340 • Elektriciteit: 3.460
Twee-onder-één-kap woning
Gas: 890 • Elektriciteit: 2.640
Totaal aantal bedrijfsvestigingen: 290
| Periode | Misdrijven |
|---|---|
| jan 2026 | 6 |
| jul 2025 | 7 |
| jun 2025 | 10 |
| mei 2025 | 5 |
| mrt 2025 | 5 |
| mrt 2026 | 3 |
| nov 2024 | 10 |
| nov 2025 | 6 |
| okt 2024 | 5 |
| okt 2025 | 2 |
| sep 2024 | 4 |
| sep 2025 | 3 |
Deze cijfers geven een indicatief beeld van veiligheidstrends in de woonomgeving van Ittervoort.
Korte antwoorden op basis van actuele plaatscijfers, handig voor een snelle vergelijking van de woonomgeving.
Ittervoort telt in 2026 ongeveer 1.663 inwoners.
De gemiddelde WOZ-waarde in Ittervoort is in 2025 circa € 350.000.
Het gemiddelde inkomen per inwoner in Ittervoort ligt rond € 32.000 per jaar.
Voor het huidige jaar gaat het om ongeveer 60 geregistreerde misdrijven. Gebruik deze cijfers als indicatie en vergelijk trends per periode.
In Ittervoort komt vooral "Vrijstaande woningen" veel voor, met ongeveer 336 woningen.
Bekijk meer woningen in deze plaats.
6014BV Ittervoort
€ 325.000 k.k.
€ 3.385/m²

6014BE Ittervoort
€ 339.000 k.k.
€ 3.168/m²

6014AB Ittervoort
€ 195.000 k.k.

6014BJ Ittervoort
€ 375.000 k.k.
€ 3.049/m²

6014BT Ittervoort
€ 499.000 k.k.
€ 3.441/m²

6014AE Ittervoort
€ 250.000 k.k.
€ 2.174/m²
6014BA Ittervoort
€ 359.500 k.k.
€ 2.899/m²

6014EH Ittervoort
€ 525.000 k.k.
€ 3.220/m²
