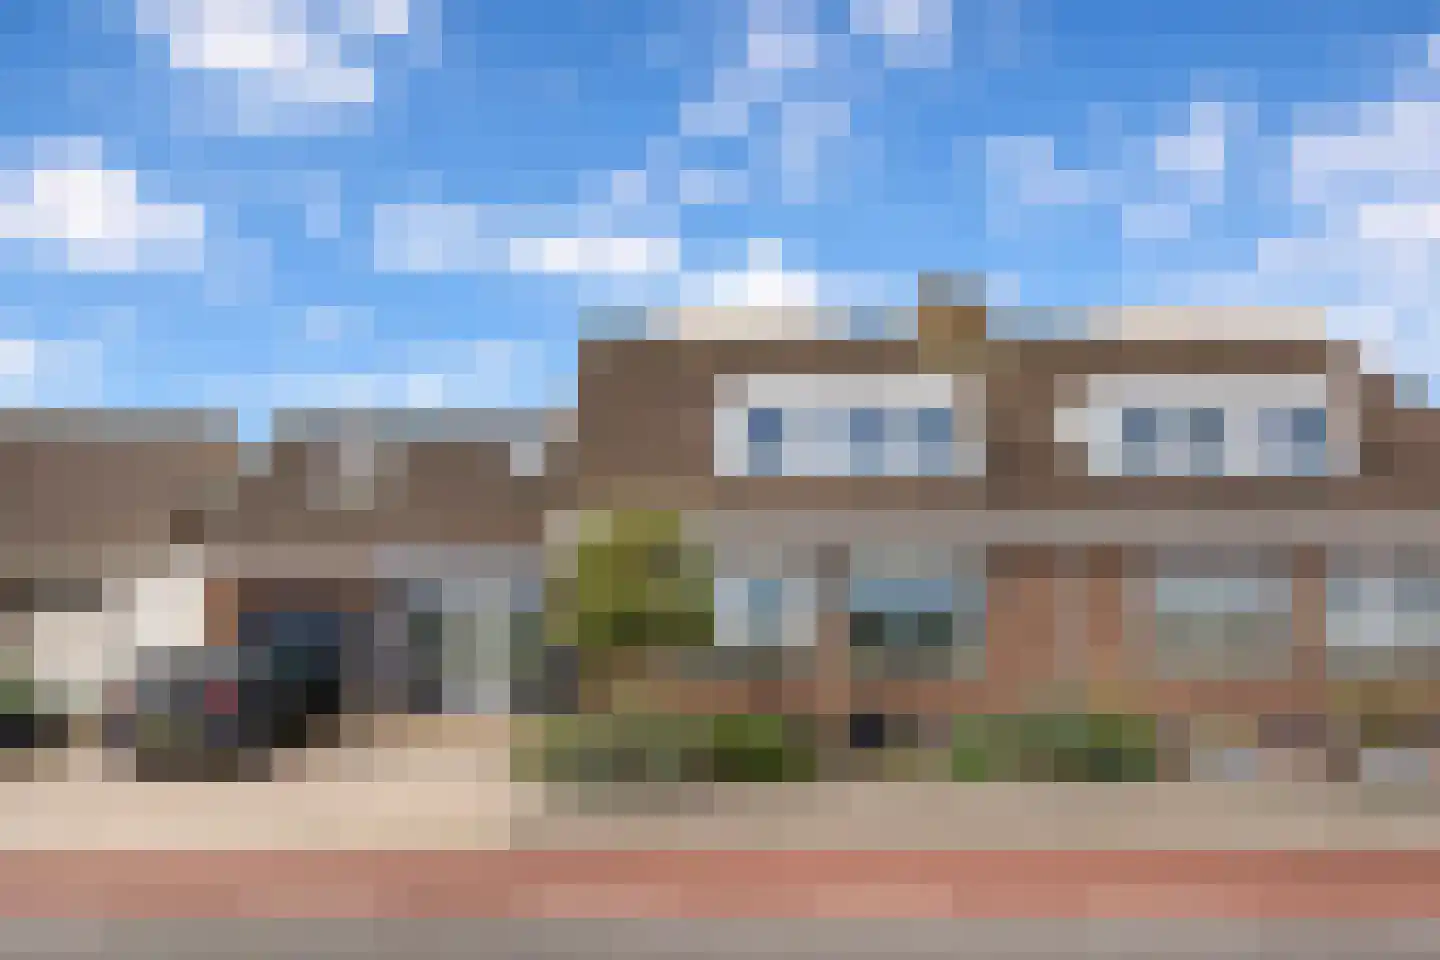
Houses sold in Lijnden

View 8 sold houses in Lijnden

Connected to: Vastgoed Nederland NVM Makelaars

On this page you will find recently sold homes in Lijnden. Use this overview to better estimate selling prices, popular neighborhoods, and the local housing supply before you choose a real estate agent. Also view the current housing supply with 17 houses in Lijnden.

Selection

Search and filter homes

Set your preferences and discover homes that suit you.

Total supply 241.423
Filters

Set price, area and other characteristics. Adjust a filter or click on Show homes. Location changes directly above.

Reset filters

You search for

  • Place Lijnden
  • Status Sold

Huis verkopen in Lijnden? Vergelijk verkoopmakelaars

Bekijk recente verkopen en ontvang gratis offertes van lokale verkoopmakelaars in Lijnden.

Free request a quote

  • Quotes in Lijnden
  • Non-binding
  • Personal
  • Gratis tarieven vergelijken

Zelf je woning verkopen in Lijnden? Vergelijk verkoopmakelaars in Lijnden of bekijk de beste verkoopmakelaars in Lijnden als referentie bij jouw keuze.

Vergelijk meerdere offertes

Makelaars maken scherpere voorstellen als ze weten dat je vergelijkt — vraag offertes aan voor verkoop of aankoop.

Frequently asked questions about sold homes in Lijnden

Short answers about housing prices, sold homes and comparing real estate agents in Lijnden.

Residential and neighborhood statistics in Lijnden

View current location data on residents, WOZ development, housing stock, energy consumption, business activity and safety in Lijnden. In 2025 were there 985 residents. The average WOZ value in 2025 is EUR 539.333.

These figures help to better assess and compare the housing stock in Lijnden with recent sold homes. Orient yourself then on suitable top real estate agents in Lijnden for sales advice in this region.

Residents

985

Last year: 2025

Average WOZ

EUR 539.333

Last year: 2025

Average income per person.

EUR 35.969

Source: AllNumbers

Crimes (current year)

118

Total registered

Demographics and WOZ development

Inhabitants per year

Inhabitants per year in Lijnden
Year Residents
2021 875
2022 880
2023 955
2024 920
2025 985

Annual WOZ value

WOZ value per year in Lijnden
Year Average WOZ
2021 EUR 384.933
2022 EUR 439.020
2023 EUR 516.908
2024 EUR 520.740
2025 EUR 539.333

Composition of residents

Age build-up

65+: 195 0-15: 115 15-25: 120 25-45: 245 45-65: 300

Education level

Hoger

200

Praktisch

120

Middelbaar

290

Origin of residents (2025)

Europa

125

Nederland

660

Buiten Europa

190

Housing stock and construction periods

Types of homes

Hoekwoningen 43
Appartementen 25
Tussenwoningen 53
Vrijstaande woningen 158
Twee-onder-één-kap woningen 120

Construction period of buildings

Voor 1700 0
1700 tot 1900 8
1900 tot 1925 85
1925 tot 1950 93
1950 tot 1970 79
1970 tot 1980 56
1980 tot 1990 21
1990 tot 2000 30
2000 tot 2010 84
2010 tot 2020 106
2020 en later 208

Energy and sustainability

Energy label distribution

Label A

548

Label G

136

Label C

75

Label D

62

Label B

44

Label A+

28

Label F

23

Label E

16

Label A++

15

Label A++++

8

Label A+++

6

Label A+++++

5

Average energy consumption per year

Average energy consumption per year in Lijnden
Year Gas (m3) Electricity (kWh)
2020 1.807 3.812
2021 2.062 3.923
2022 1.571 3.768
2023 1.331 3.609
2024 1.283 3.736

Consumption per house type

Hoekwoning

Gas: 1.237 • Electricity: 3.408

Huurwoning

Gas: 1.212 • Electricity: 3.163

Koopwoning

Gas: 1.379 • Electricity: 3.765

Appartement

Gas: 883 • Electricity: 2.351

Tussenwoning

Gas: 1.132 • Electricity: 3.282

Vrijstaande woning

Gas: 1.596 • Electricity: 4.203

Twee-onder-één-kap woning

Gas: 1.252 • Electricity: 3.468

Business activity in Lijnden (2025)

Handel en HORECA 195
Nijverheid en energie 120
Zakelijke dienstverlening 130
Overheid, onderwijs en zorg 45
Landbouw, bosbouw en visserij 15
Vervoer, informatie en communicatie 65
Financiele diensten en onroerendgoed 45
Cultuur, recreatie en overige diensten 45

Total number of company establishments: 655

Recent crime statistics

Recent crime statistics in Lijnden
Period Crimes
jan 2025 2
jan 2026 13
jul 2025 9
jun 2025 13
mei 2025 9
mrt 2025 12
nov 2024 12
nov 2025 13
okt 2024 5
okt 2025 13
sep 2024 5
sep 2025 12

These figures give an indicative picture of safety trends in the living environment of Lijnden.

Frequently asked questions about living in Lijnden

Short answers based on current local statistics, handy for a quick comparison of the living environment.

Hoeveel inwoners heeft Lijnden?

Lijnden telt in 2025 ongeveer 985 inwoners.

Wat is de gemiddelde WOZ-waarde in Lijnden?

De gemiddelde WOZ-waarde in Lijnden is in 2025 circa € 539.333.

Wat is het gemiddelde inkomen per inwoner in Lijnden?

Het gemiddelde inkomen per inwoner in Lijnden ligt rond € 35.969 per jaar.

Hoe veilig is wonen in Lijnden?

Voor het huidige jaar gaat het om ongeveer 118 geregistreerde misdrijven. Gebruik deze cijfers als indicatie en vergelijk trends per periode.

Welke woningtypen komen het meest voor in Lijnden?

In Lijnden komt vooral "Vrijstaande woningen" veel voor, met ongeveer 158 woningen.

Gratis vrijblijvende offertes ontvangen

Vergelijk meerdere makelaars en kies de beste match.