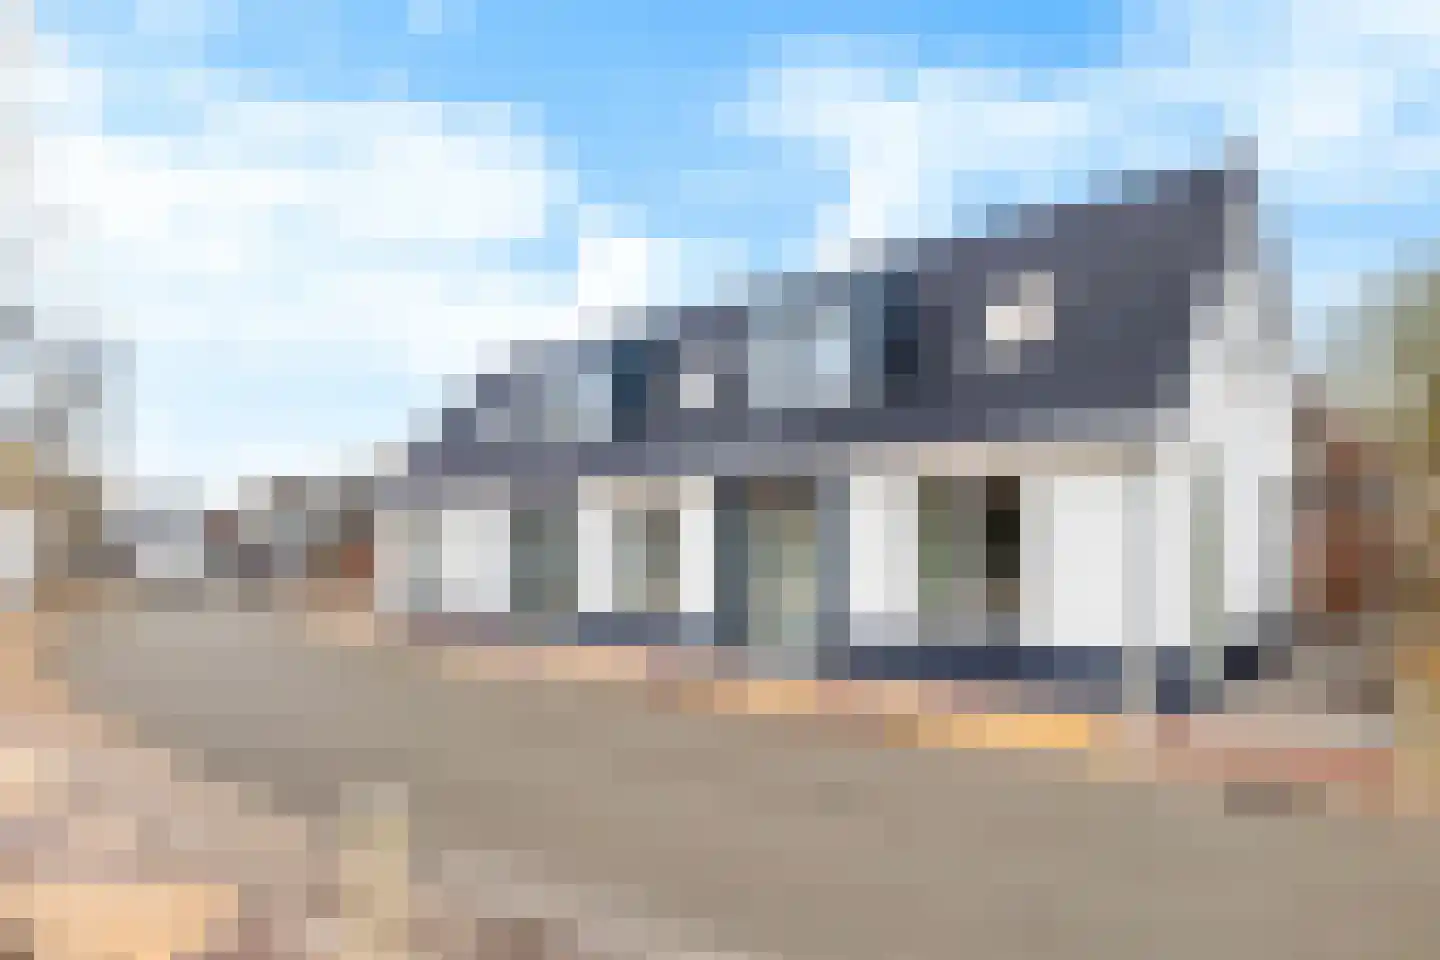
- Sold
Lage Herenweg 28
9073GC Marrum
€ 249.500 k.k.
€ 3.616/m²
- Living area
- 69 m²
- Land area
- 70 m²
- Bedrooms
- 3
View 8 sold houses in Marrum
Type to search. Use arrow down and arrow up to navigate through results and press Enter to open.
Hidden search suggestions.
Compare sold homes in Marrum or view the current offering in this location directly.
On this page you will find recently sold homes in Marrum. Use this overview to better estimate selling prices, popular neighborhoods, and the local housing supply before you choose a real estate agent. Also view the current housing supply with 15 houses in Marrum.
9073GC Marrum
€ 249.500 k.k.
€ 3.616/m²
9073HB Marrum
€ 175.000 k.k.
€ 1.804/m²
9073TT Marrum
€ 299.500 k.k.
€ 2.995/m²
9073HP Marrum
€ 249.500 k.k.
€ 2.682/m²
9073HJ Marrum
Price upon request
9073GC Marrum
€ 375.000 k.k.
€ 0/m²
9073HH Marrum
€ 275.000 k.k.
€ 2.254/m²
9073GP Marrum
€ 249.000 k.k.
€ 2.515/m²
Bekijk recente verkopen en ontvang gratis offertes van lokale makelaars. Vergelijk meer dan 41 makelaars in Marrum.
Zelf je woning verkopen in Marrum? Vergelijk verkoopmakelaars in Marrum of bekijk de beste verkoopmakelaars in Marrum als referentie bij jouw keuze.
Makelaars maken scherpere voorstellen als ze weten dat je vergelijkt — vraag offertes aan voor verkoop of aankoop.
Short answers about housing prices, sold homes and comparing real estate agents in Marrum.
De kosten van een makelaar in Marrum verschillen per kantoor, woningtype en verkoopaanpak. In Marrum kun je 41 real estate agents vergelijken; bekijk daarom ook de makelaars in Marrum om tarieven, presentatie en lokale ervaring beter naast elkaar te zetten.
On this page we currently show 8 sold houses in Marrum from our selection. This helps you to better assess recent transactions and the local housing market.
Houses sold in Marrum give insight into asking prices, house types and neighborhoods where recent transactions have taken place. Compare this also with the current housing stock in Marrum to better understand the market.
You can use sold homes as a first market indication, but a local real estate agent can better take into account finishing, location, maintenance and current demand in Marrum.
Vergelijk de 41 real estate agents in Marrum op lokale verkoopervaring, reviews, verwachte opbrengst, courtage en marketingaanpak. Bekijk verkoopmakelaars in Marrum of de top 10 makelaars in Marrum om snel sterke kantoren te ontdekken.
View current location data on residents, WOZ development, housing stock, energy consumption, business activity and safety in Marrum. In 2025 were there 1.410 residents. The average WOZ value in 2025 is EUR 272.117.
These figures help to better assess and compare the housing stock in Marrum with recent sold homes. Orient yourself then on suitable top real estate agents in Marrum for sales advice in this region.
Residents
1.410
Last year: 2025
Average WOZ
EUR 272.117
Last year: 2025
Average income per person.
EUR 24.851
Source: AllNumbers
Crimes (current year)
29
Total registered
| Year | Residents |
|---|---|
| 2021 | 1.415 |
| 2022 | 1.410 |
| 2023 | 1.410 |
| 2024 | 1.385 |
| 2025 | 1.410 |
| Year | Average WOZ |
|---|---|
| 2021 | EUR 178.439 |
| 2022 | EUR 223.055 |
| 2023 | EUR 251.447 |
| 2024 | EUR 262.282 |
| 2025 | EUR 272.117 |
Hoger
140
Praktisch
300
Middelbaar
510
Europa
35
Nederland
1.305
Buiten Europa
65
Label G
192
Label C
139
Label A
95
Label B
75
Label D
63
Label F
39
Label E
19
Label A+
5
Label A+++
2
Label A++
0
Label A++++
0
Label A+++++
0
| Year | Gas (m3) | Electricity (kWh) |
|---|---|---|
| 2020 | 1.469 | 2.804 |
| 2021 | 1.610 | 2.831 |
| 2022 | 1.248 | 2.621 |
| 2023 | 1.050 | 2.523 |
| 2024 | 1.020 | 2.606 |
Hoekwoning
Gas: 809 • Electricity: 1.739
Huurwoning
Gas: 933 • Electricity: 2.140
Koopwoning
Gas: 1.115 • Electricity: 2.733
Appartement
Gas: 542 • Electricity: 1.834
Tussenwoning
Gas: 801 • Electricity: 1.722
Vrijstaande woning
Gas: 1.219 • Electricity: 2.885
Twee-onder-één-kap woning
Gas: 849 • Electricity: 2.160
Total number of company establishments: 160
| Period | Crimes |
|---|---|
| jan 2025 | 2 |
| jan 2026 | 2 |
| jul 2025 | 3 |
| jun 2025 | 1 |
| mei 2025 | 0 |
| mrt 2025 | 4 |
| nov 2024 | 0 |
| nov 2025 | 6 |
| okt 2024 | 3 |
| okt 2025 | 5 |
| sep 2024 | 1 |
| sep 2025 | 1 |
These figures give an indicative picture of safety trends in the living environment of Marrum.
Short answers based on current local statistics, handy for a quick comparison of the living environment.
Marrum telt in 2025 ongeveer 1.410 inwoners.
De gemiddelde WOZ-waarde in Marrum is in 2025 circa € 272.117.
Het gemiddelde inkomen per inwoner in Marrum ligt rond € 24.851 per jaar.
Voor het huidige jaar gaat het om ongeveer 29 geregistreerde misdrijven. Gebruik deze cijfers als indicatie en vergelijk trends per periode.
In Marrum komt vooral "Vrijstaande woningen" veel voor, met ongeveer 289 woningen.