- Available
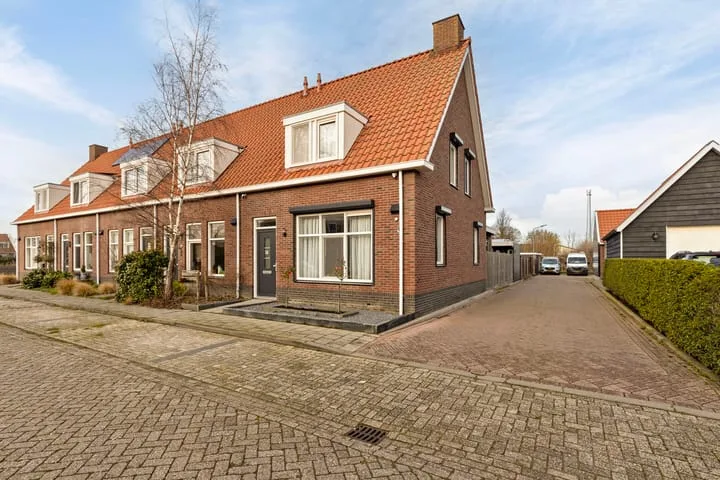
Jan Vaderstraat 6
4365BH Meliskerke
€ 695.000 k.k.
A
Save as favorite
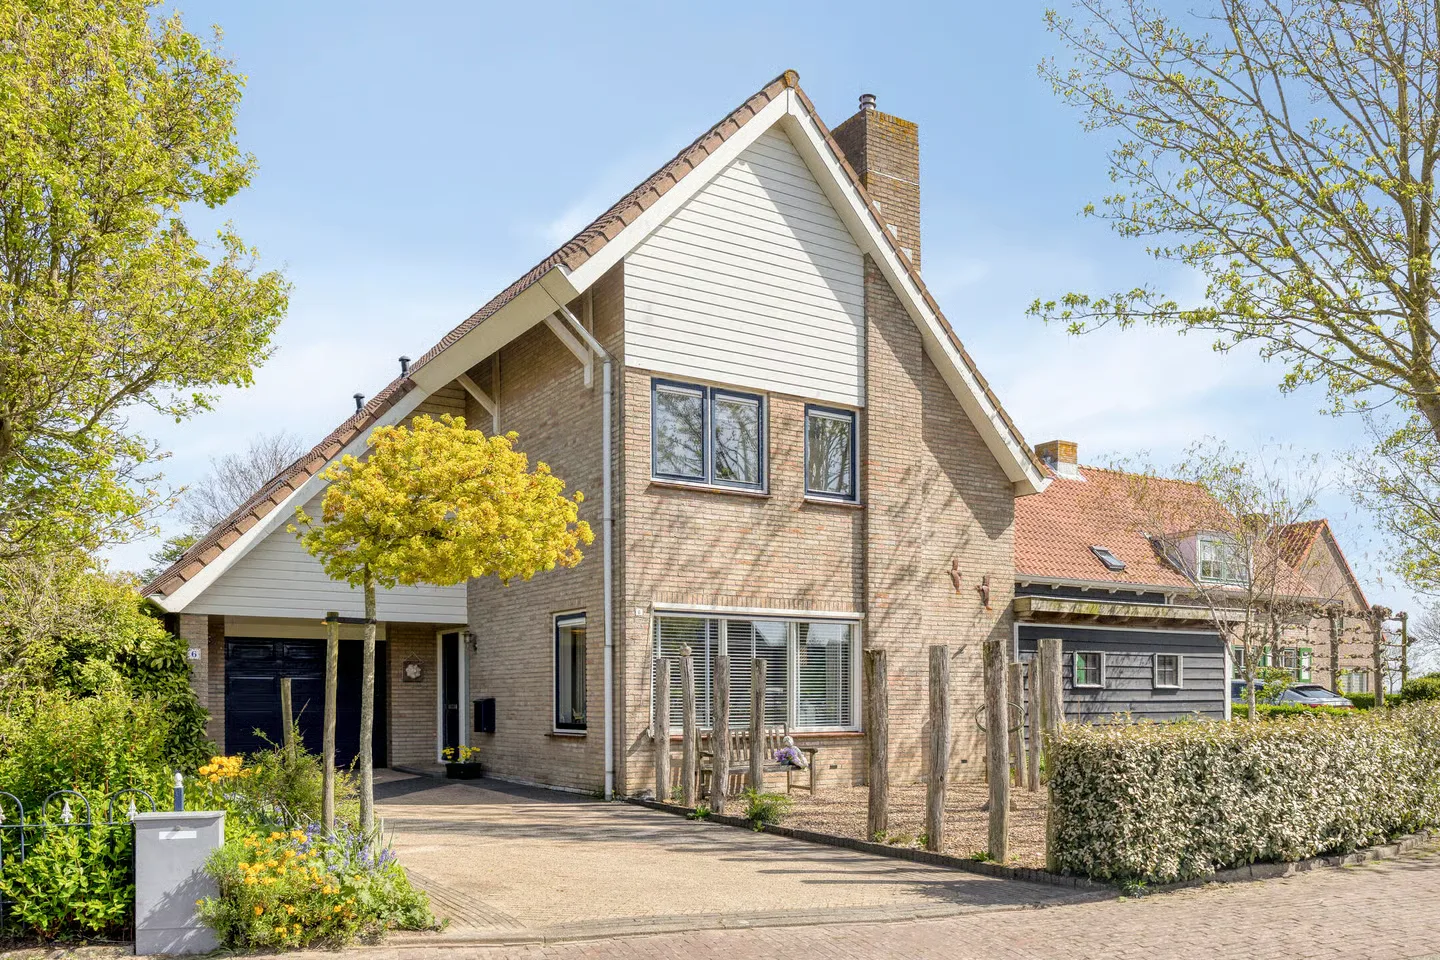
- Living area
- 145 m²
- Land area
- 580 m²
- Bedrooms
- 5