- Sold
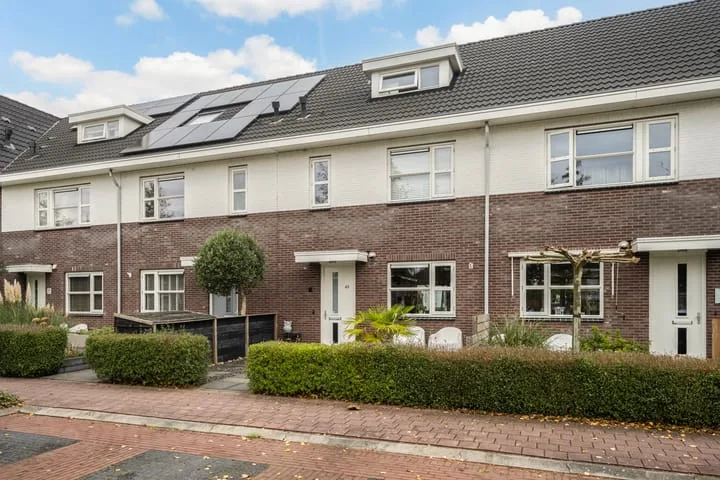
Tulpenstraat 31
7943AN Meppel
€ 239.500 k.k.
€ 3.574/m²
G
Save as favorite
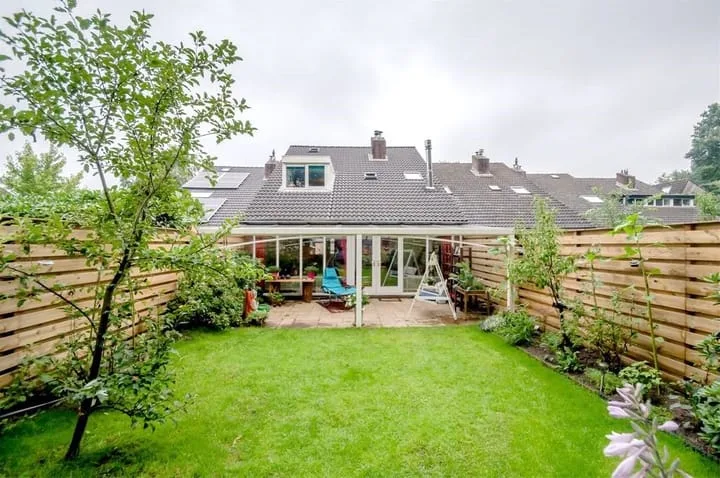
- Living area
- 67 m²
- Land area
- 83 m²
- Bedrooms
- 3